.Spendflo Reporting is a comprehensive module designed to help you manage, analyze, and optimize your SaaS portfolio. By providing deep insights into your SaaS spend, usage patterns, and vendor contracts, these pre-built reports empower your finance, procurement, and IT teams to make data-driven decisions, control costs, and mitigate risks. For a general overview of the reporting module
How to Access and View Pre-built Reports
Follow these steps to navigate through the available reports in your Spendflo dashboard:
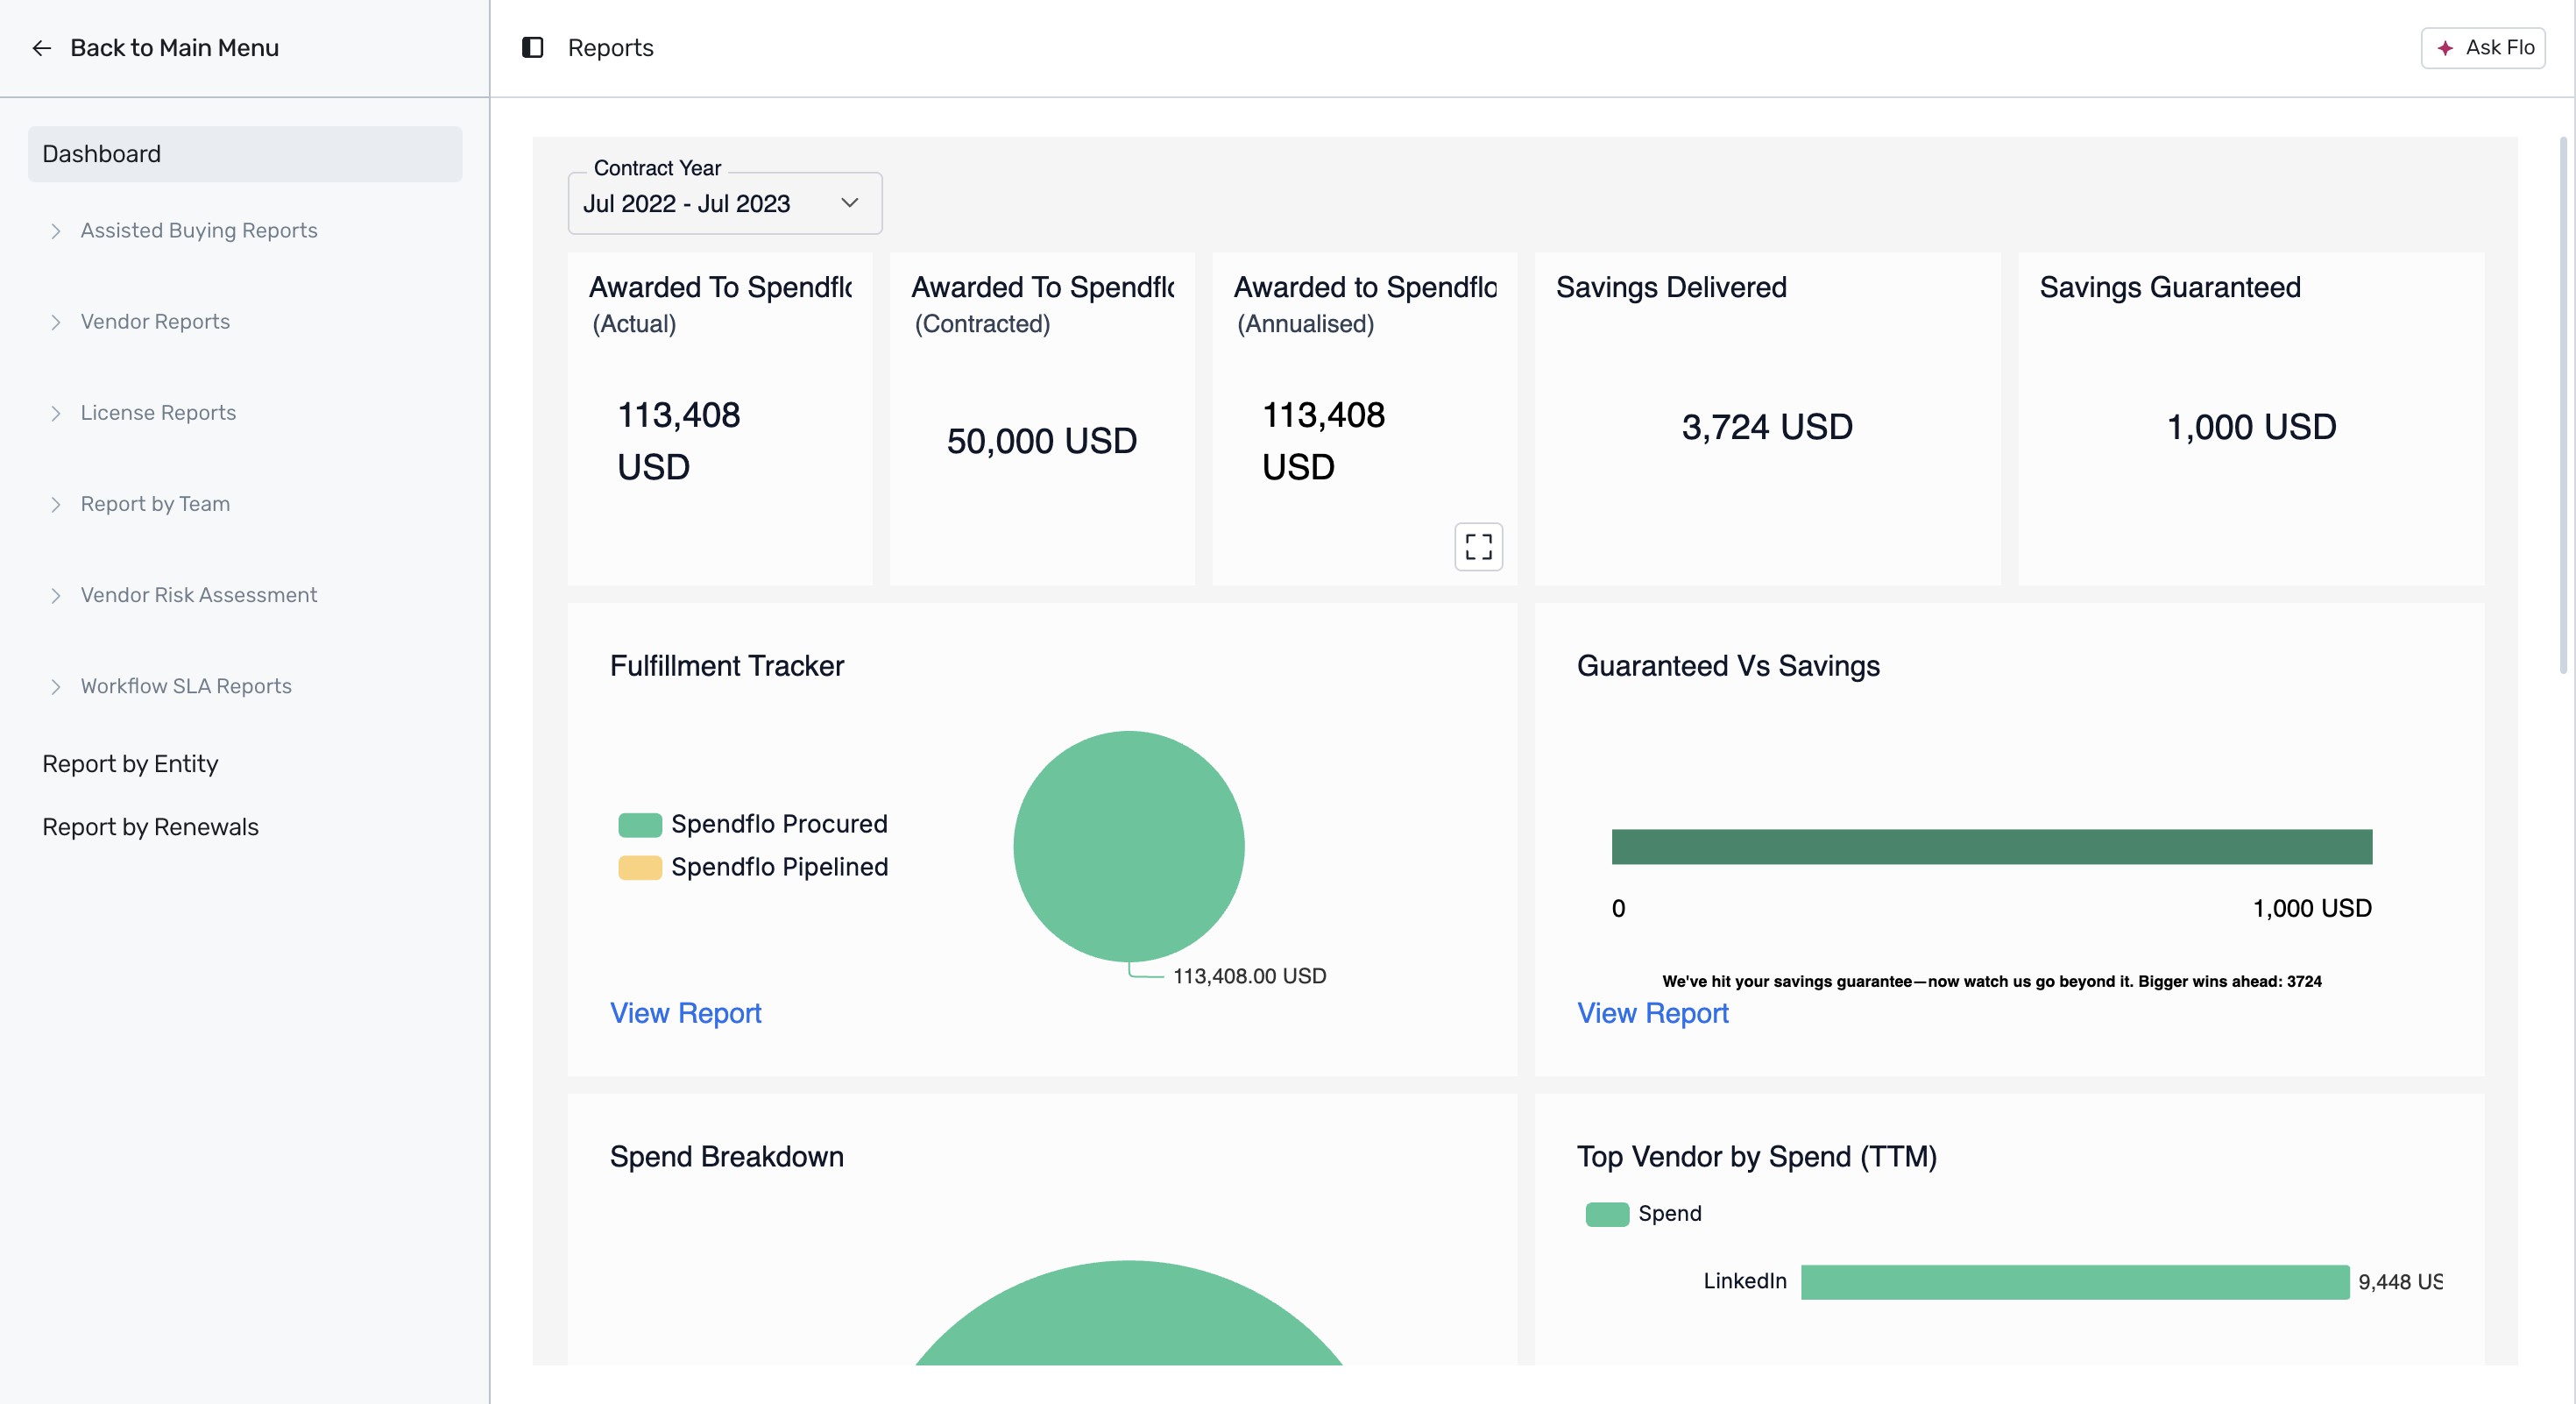
Navigate to the Reports section by clicking on Reports in the main navigation menu. This will open the Reports Dashboard where you can view high-level metrics such as actual and contracted spend awarded to Spendflo, delivered and guaranteed savings, fulfillment tracking, and top vendors.
Once the dashboard loads completely, you will see a comprehensive overview of your procurement metrics.
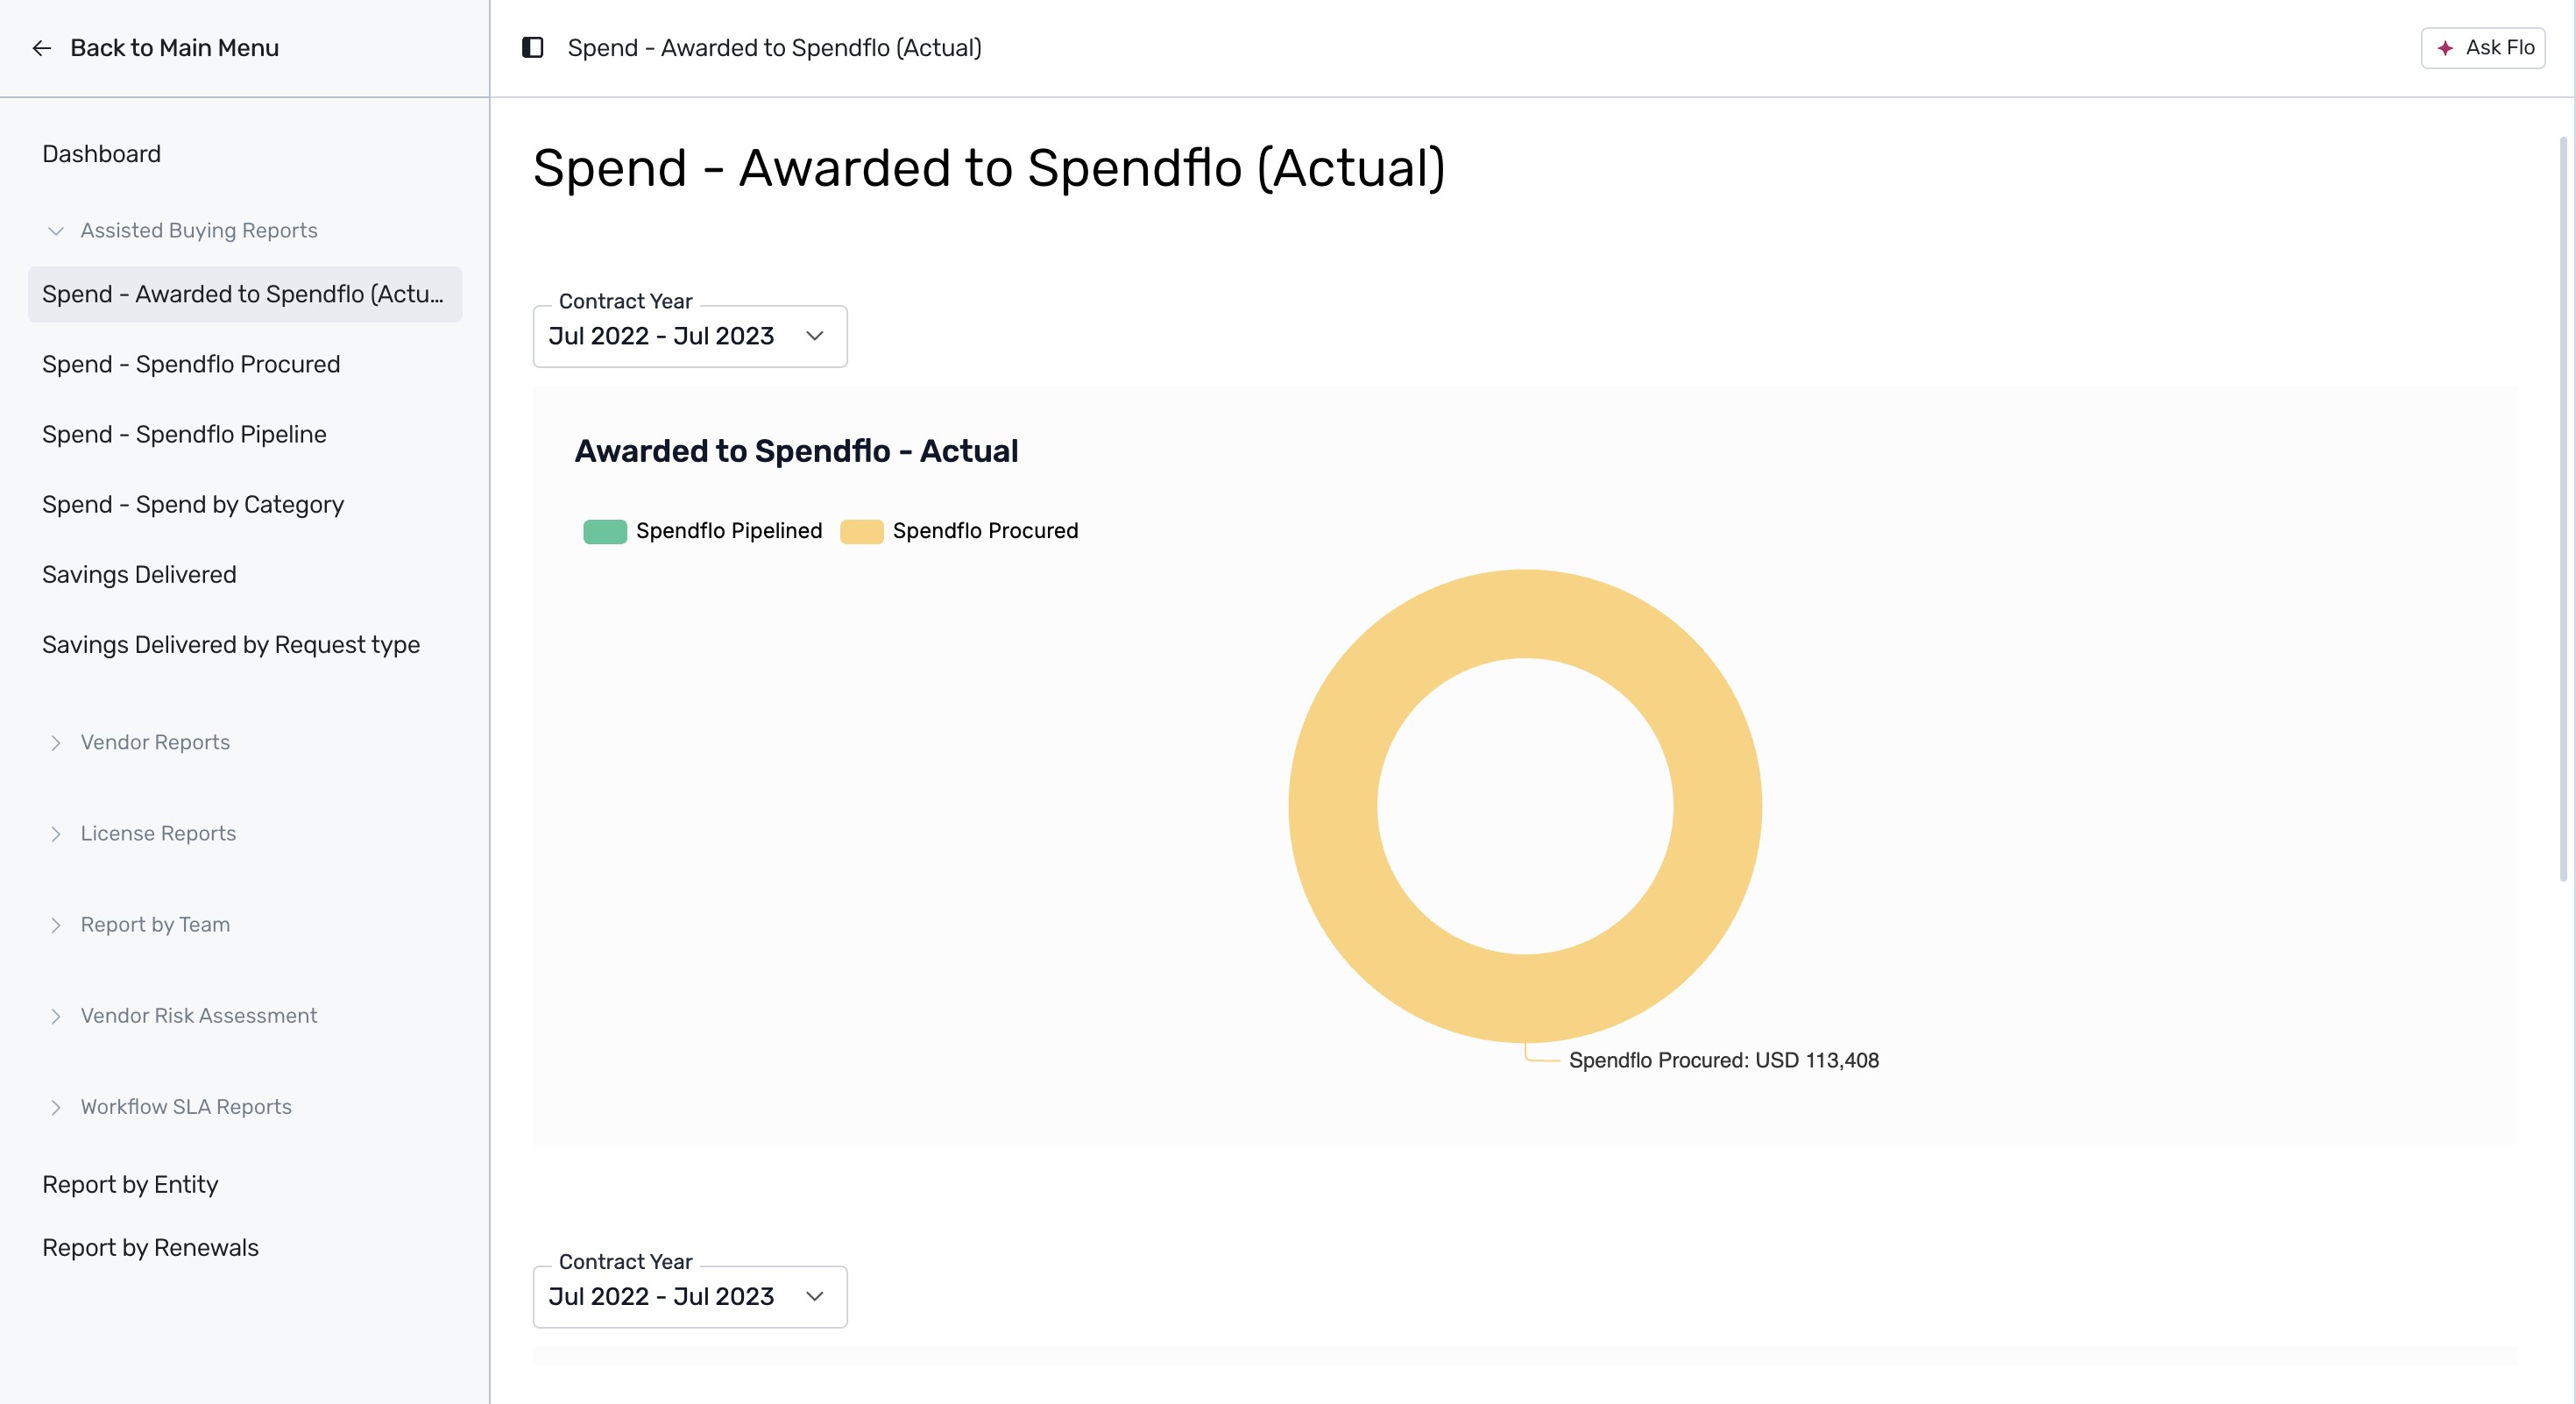
Expand the Assisted Buying Reports menu on the left sidebar and click on Spend - Awarded to Spendflo (Actual). This report displays the month-on-month trend of actual spend procured versus pipelined, helping you track current and upcoming SaaS spend managed by Spendflo.
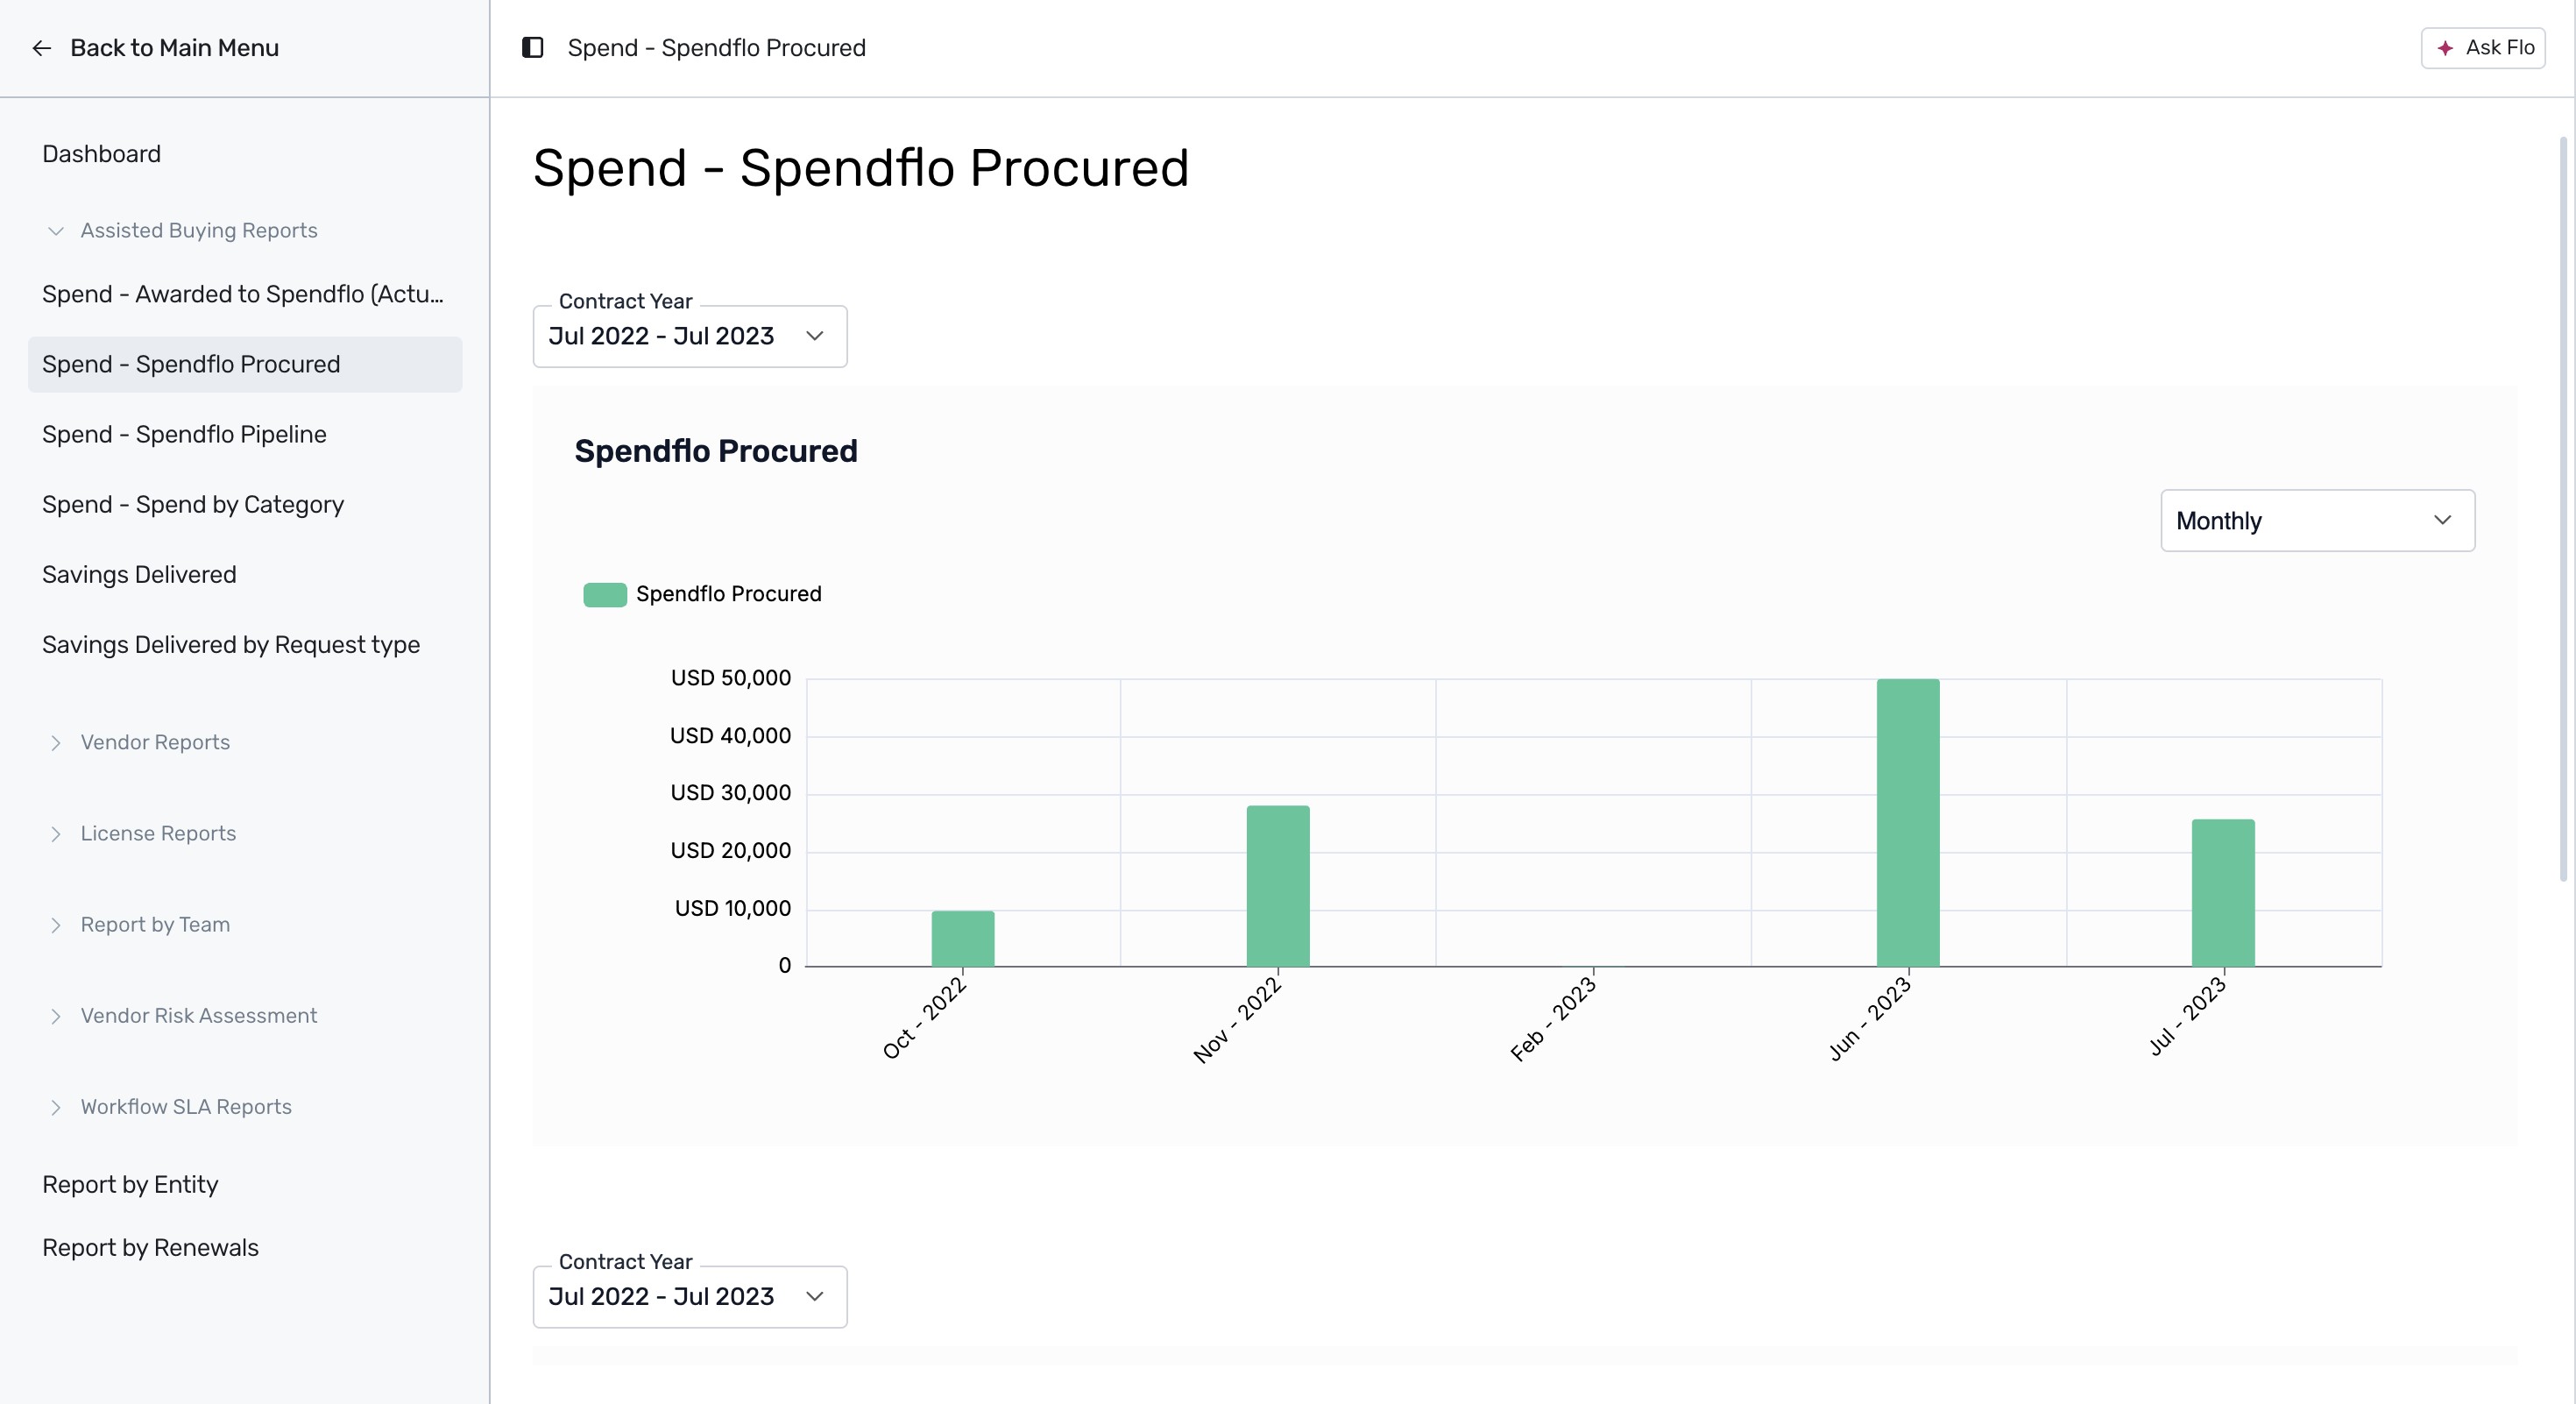
Click on Spend - Spendflo Procured to view a monthly bar chart of the spend procured through Spendflo, giving you visibility into SaaS management over time.
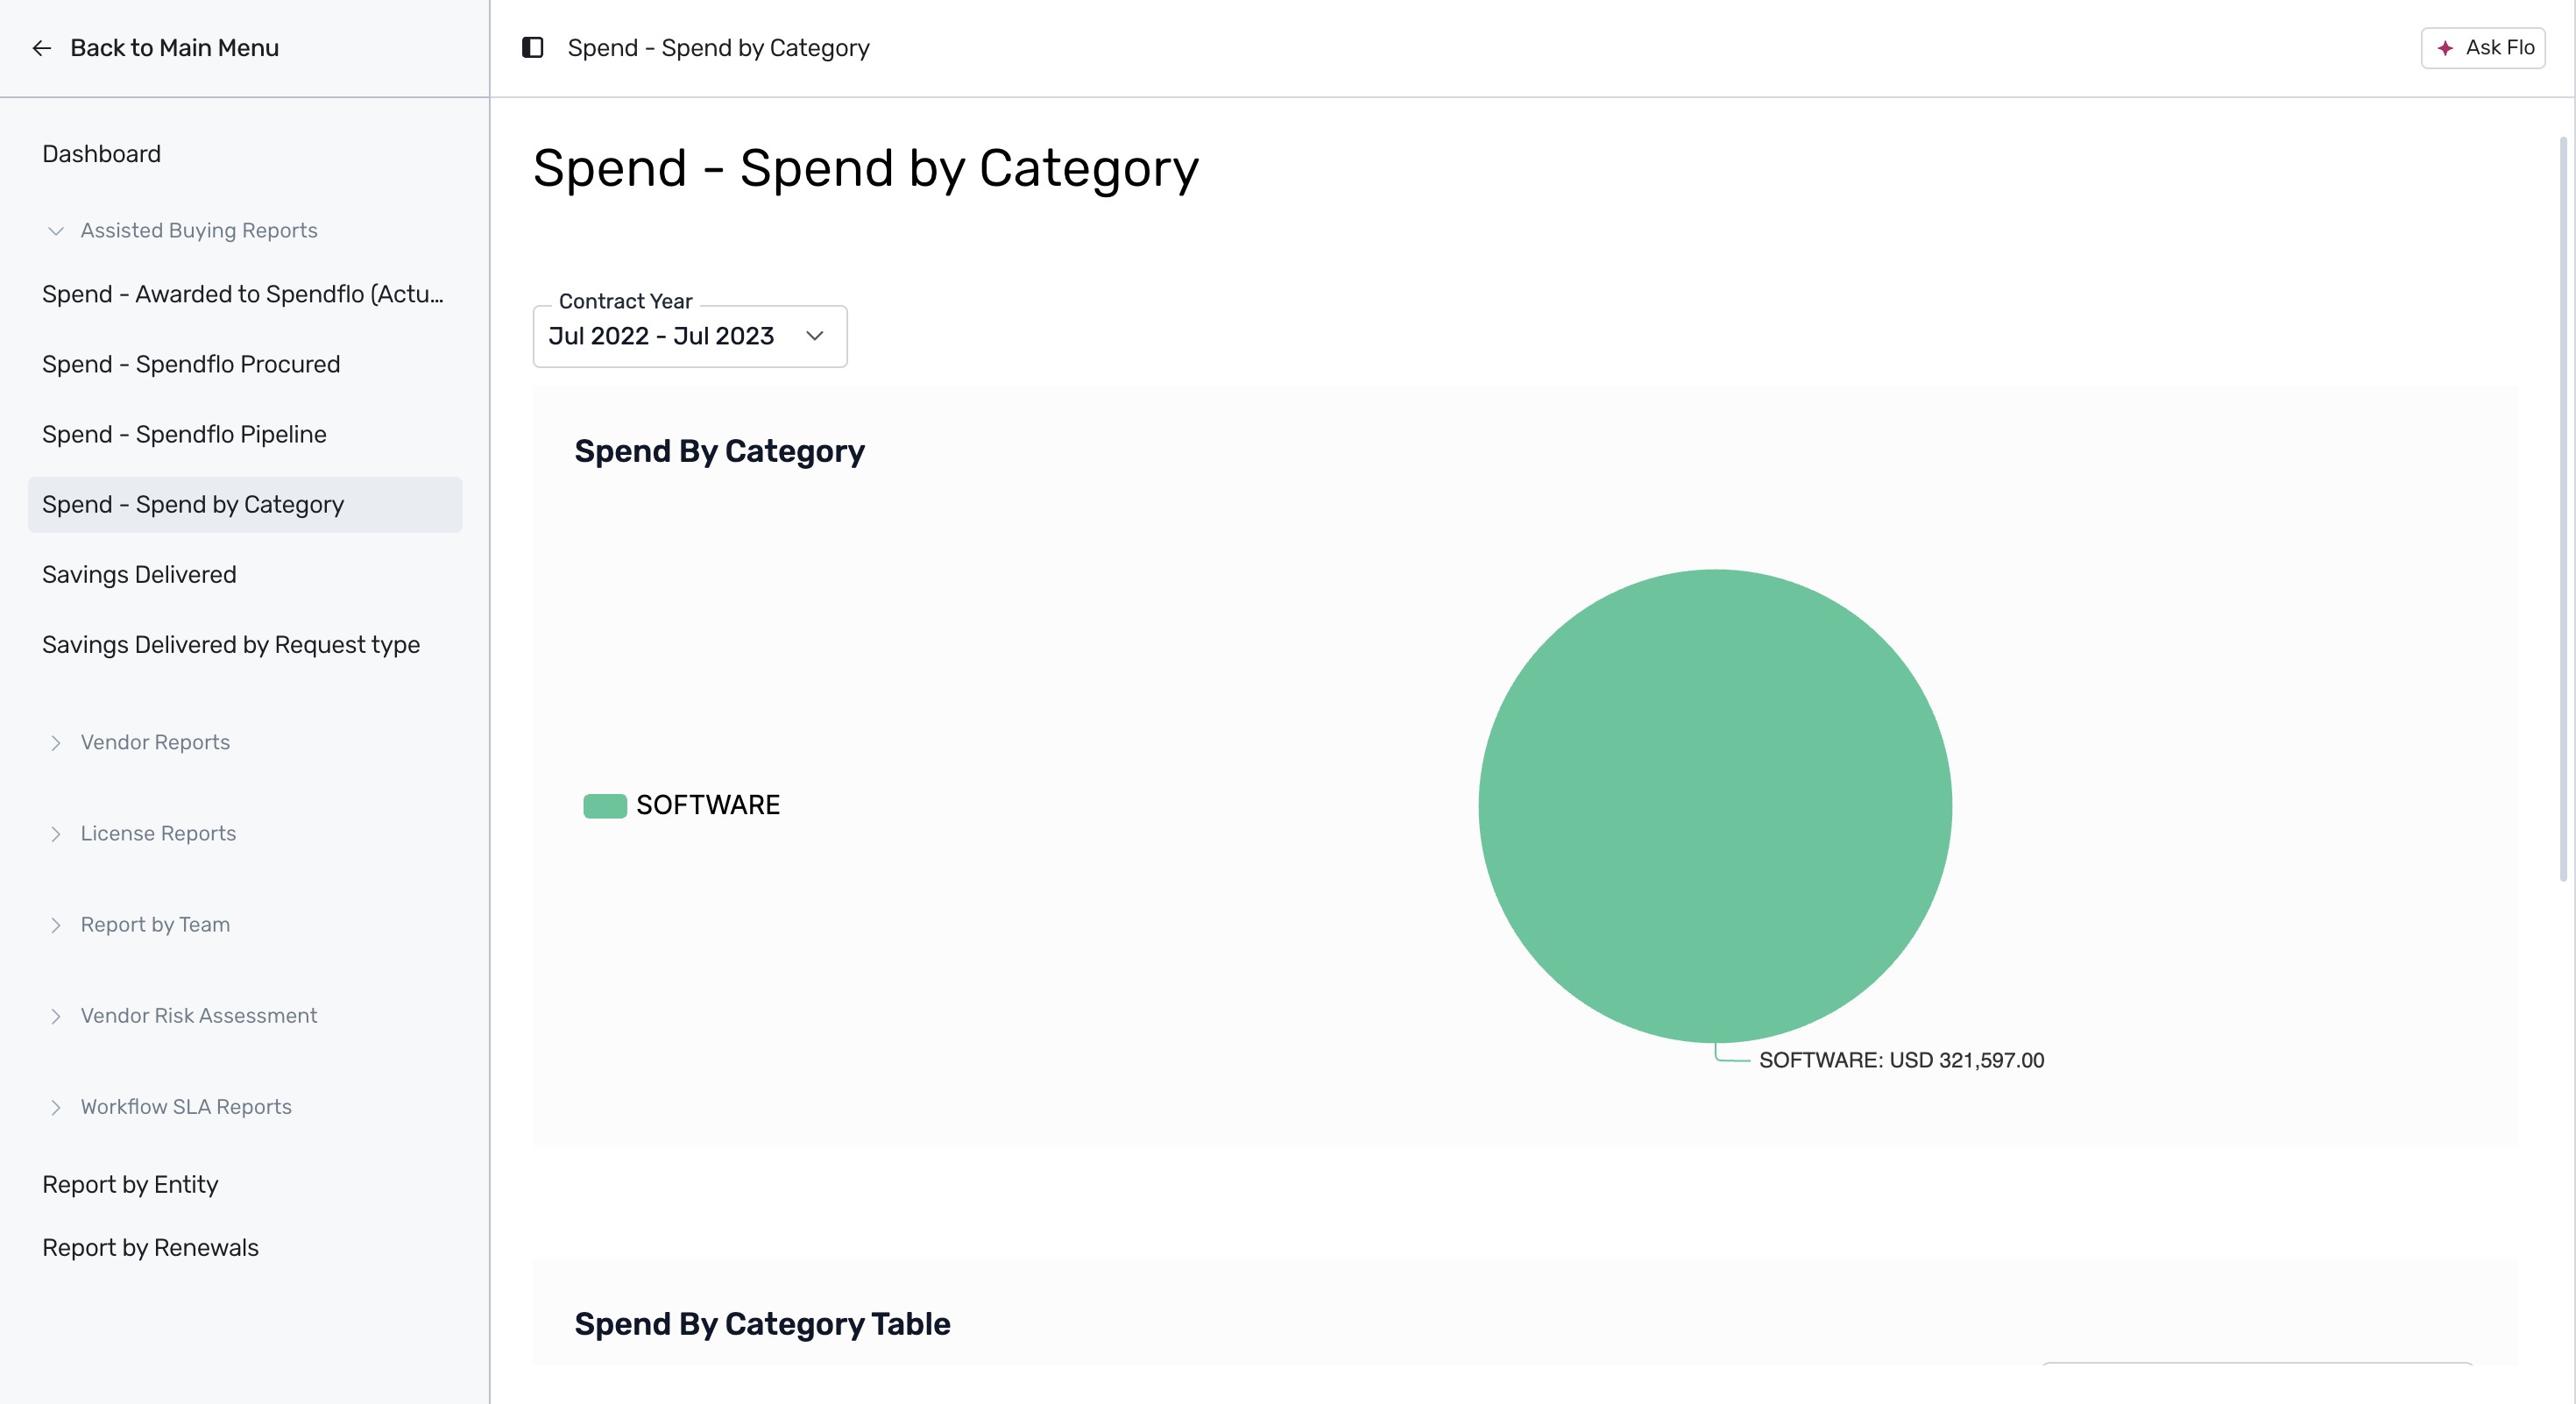
Click on Spend - Spend by Category to view a pie chart breakdown of your spend across different categories, such as Software, to understand category-wise distribution.
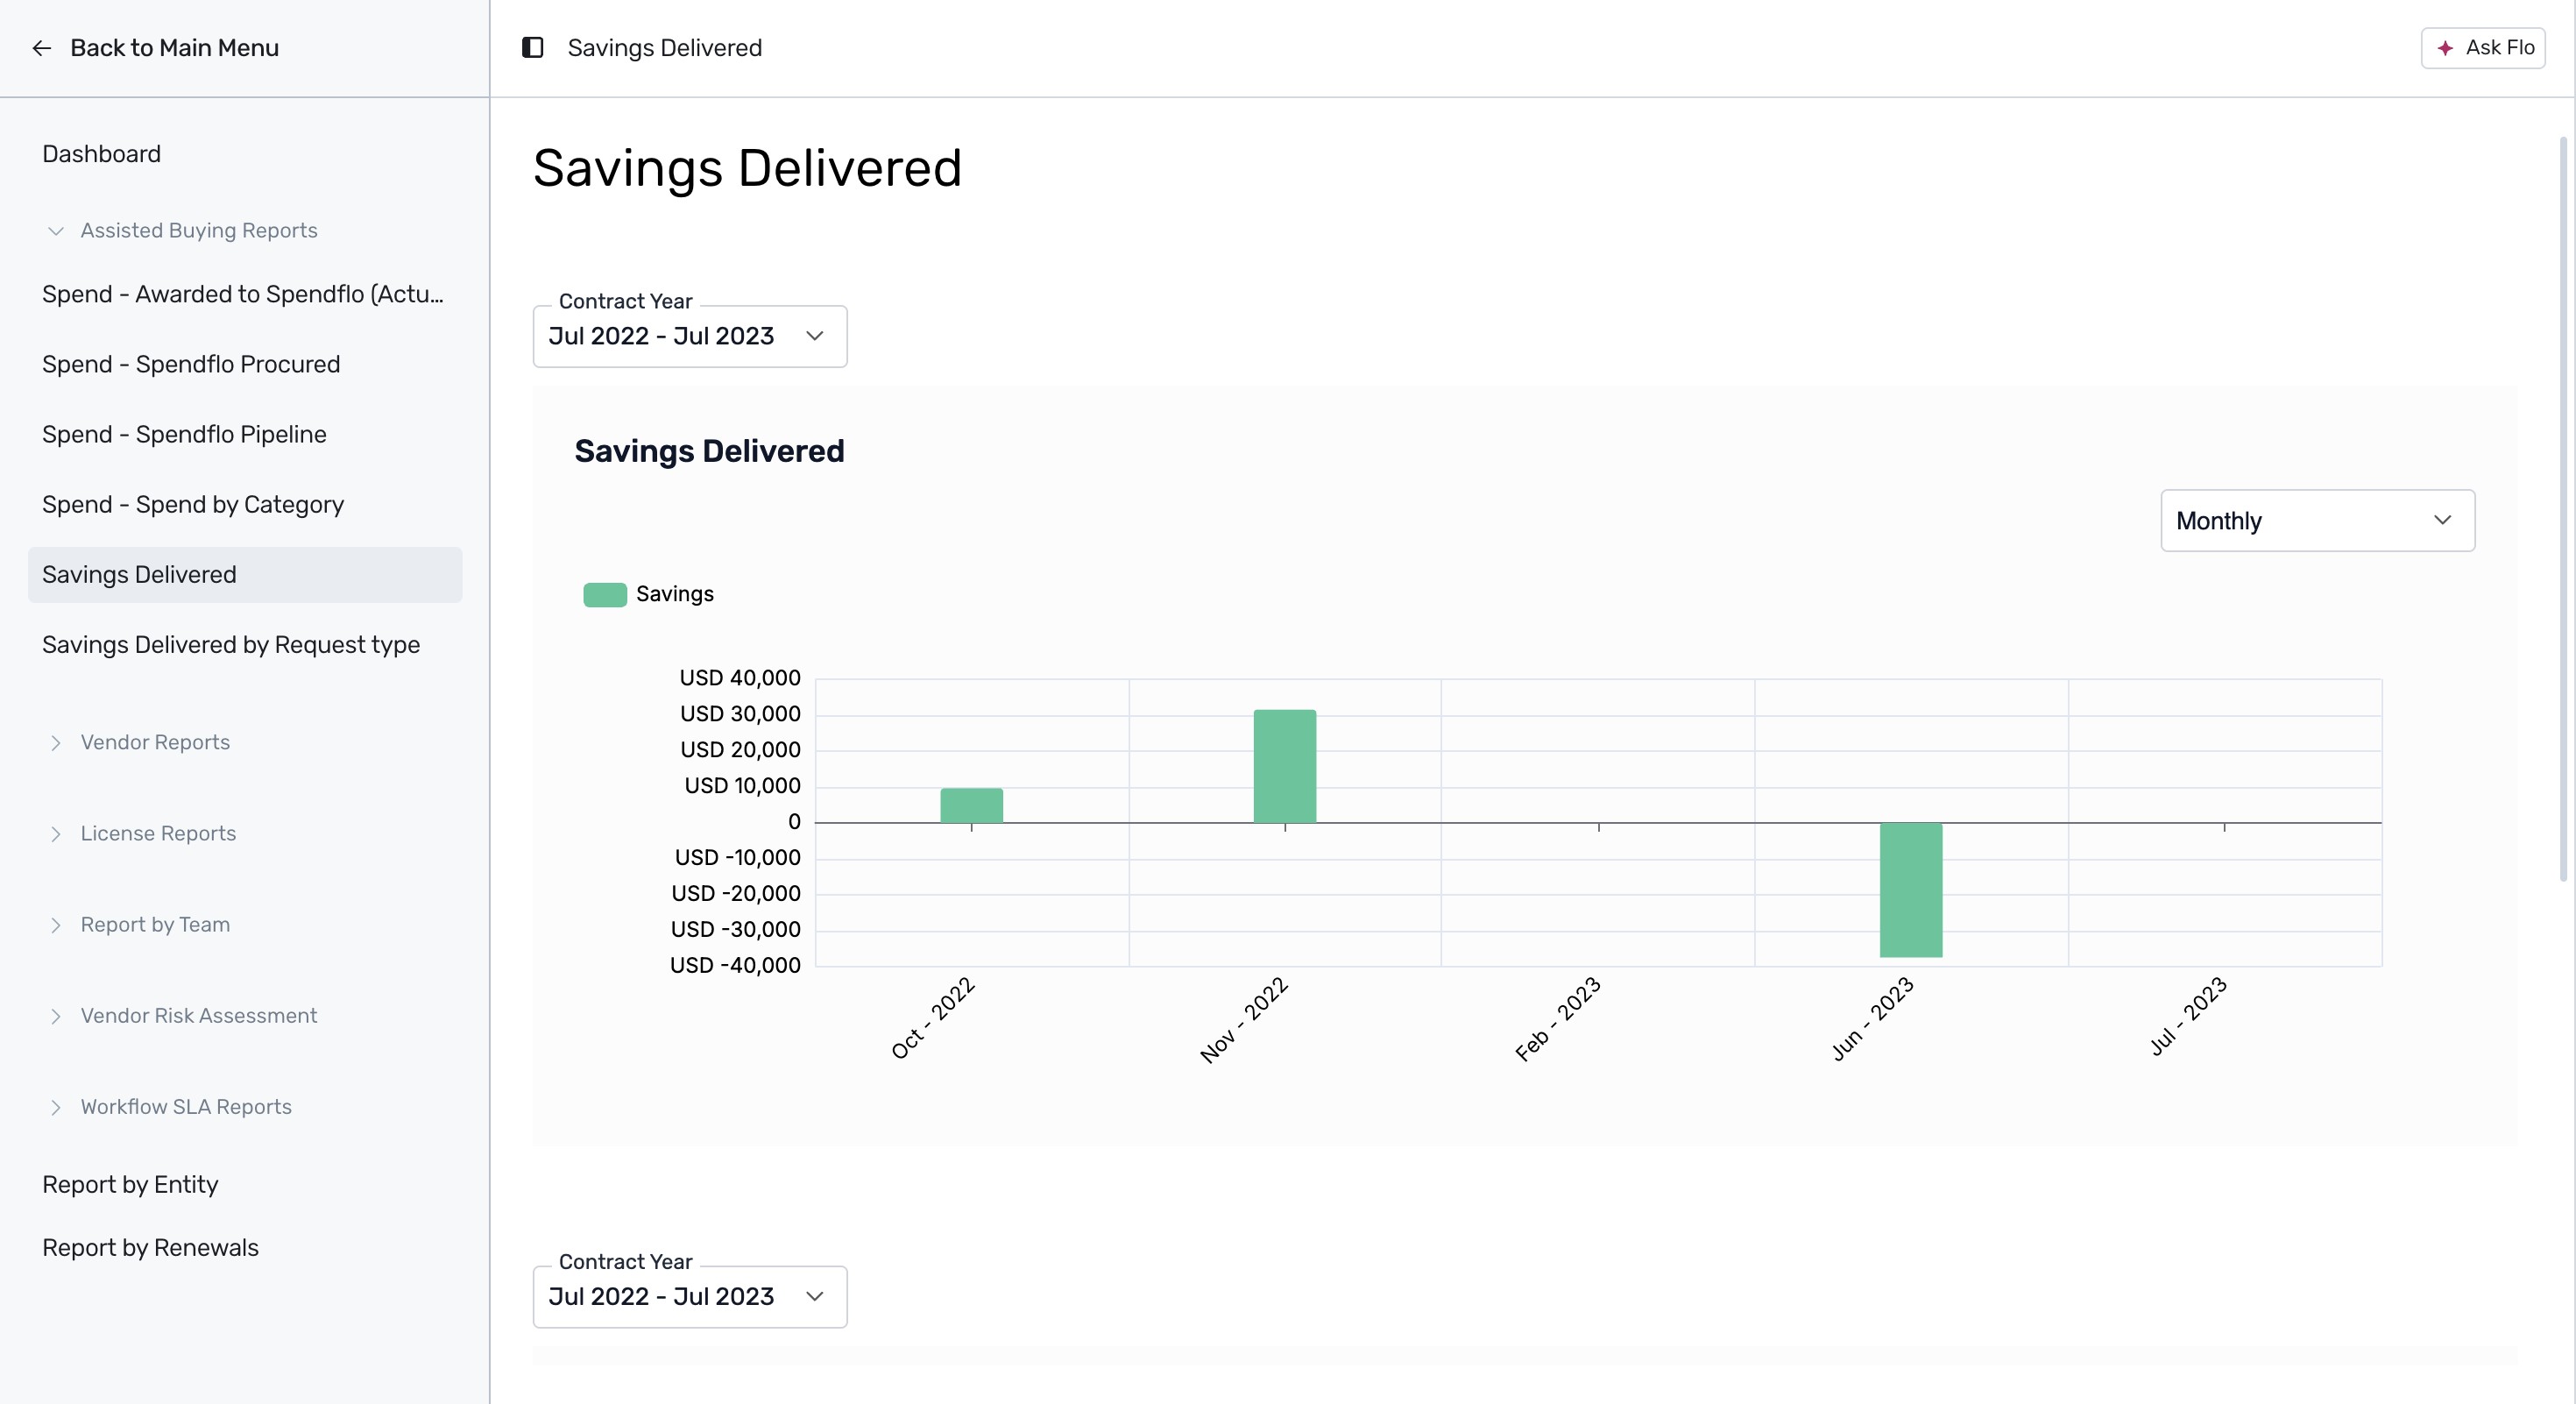
Click on Savings Delivered to view a monthly trend chart of your delivered savings. This report showcases the cumulative savings achieved by the Spendflo Team.
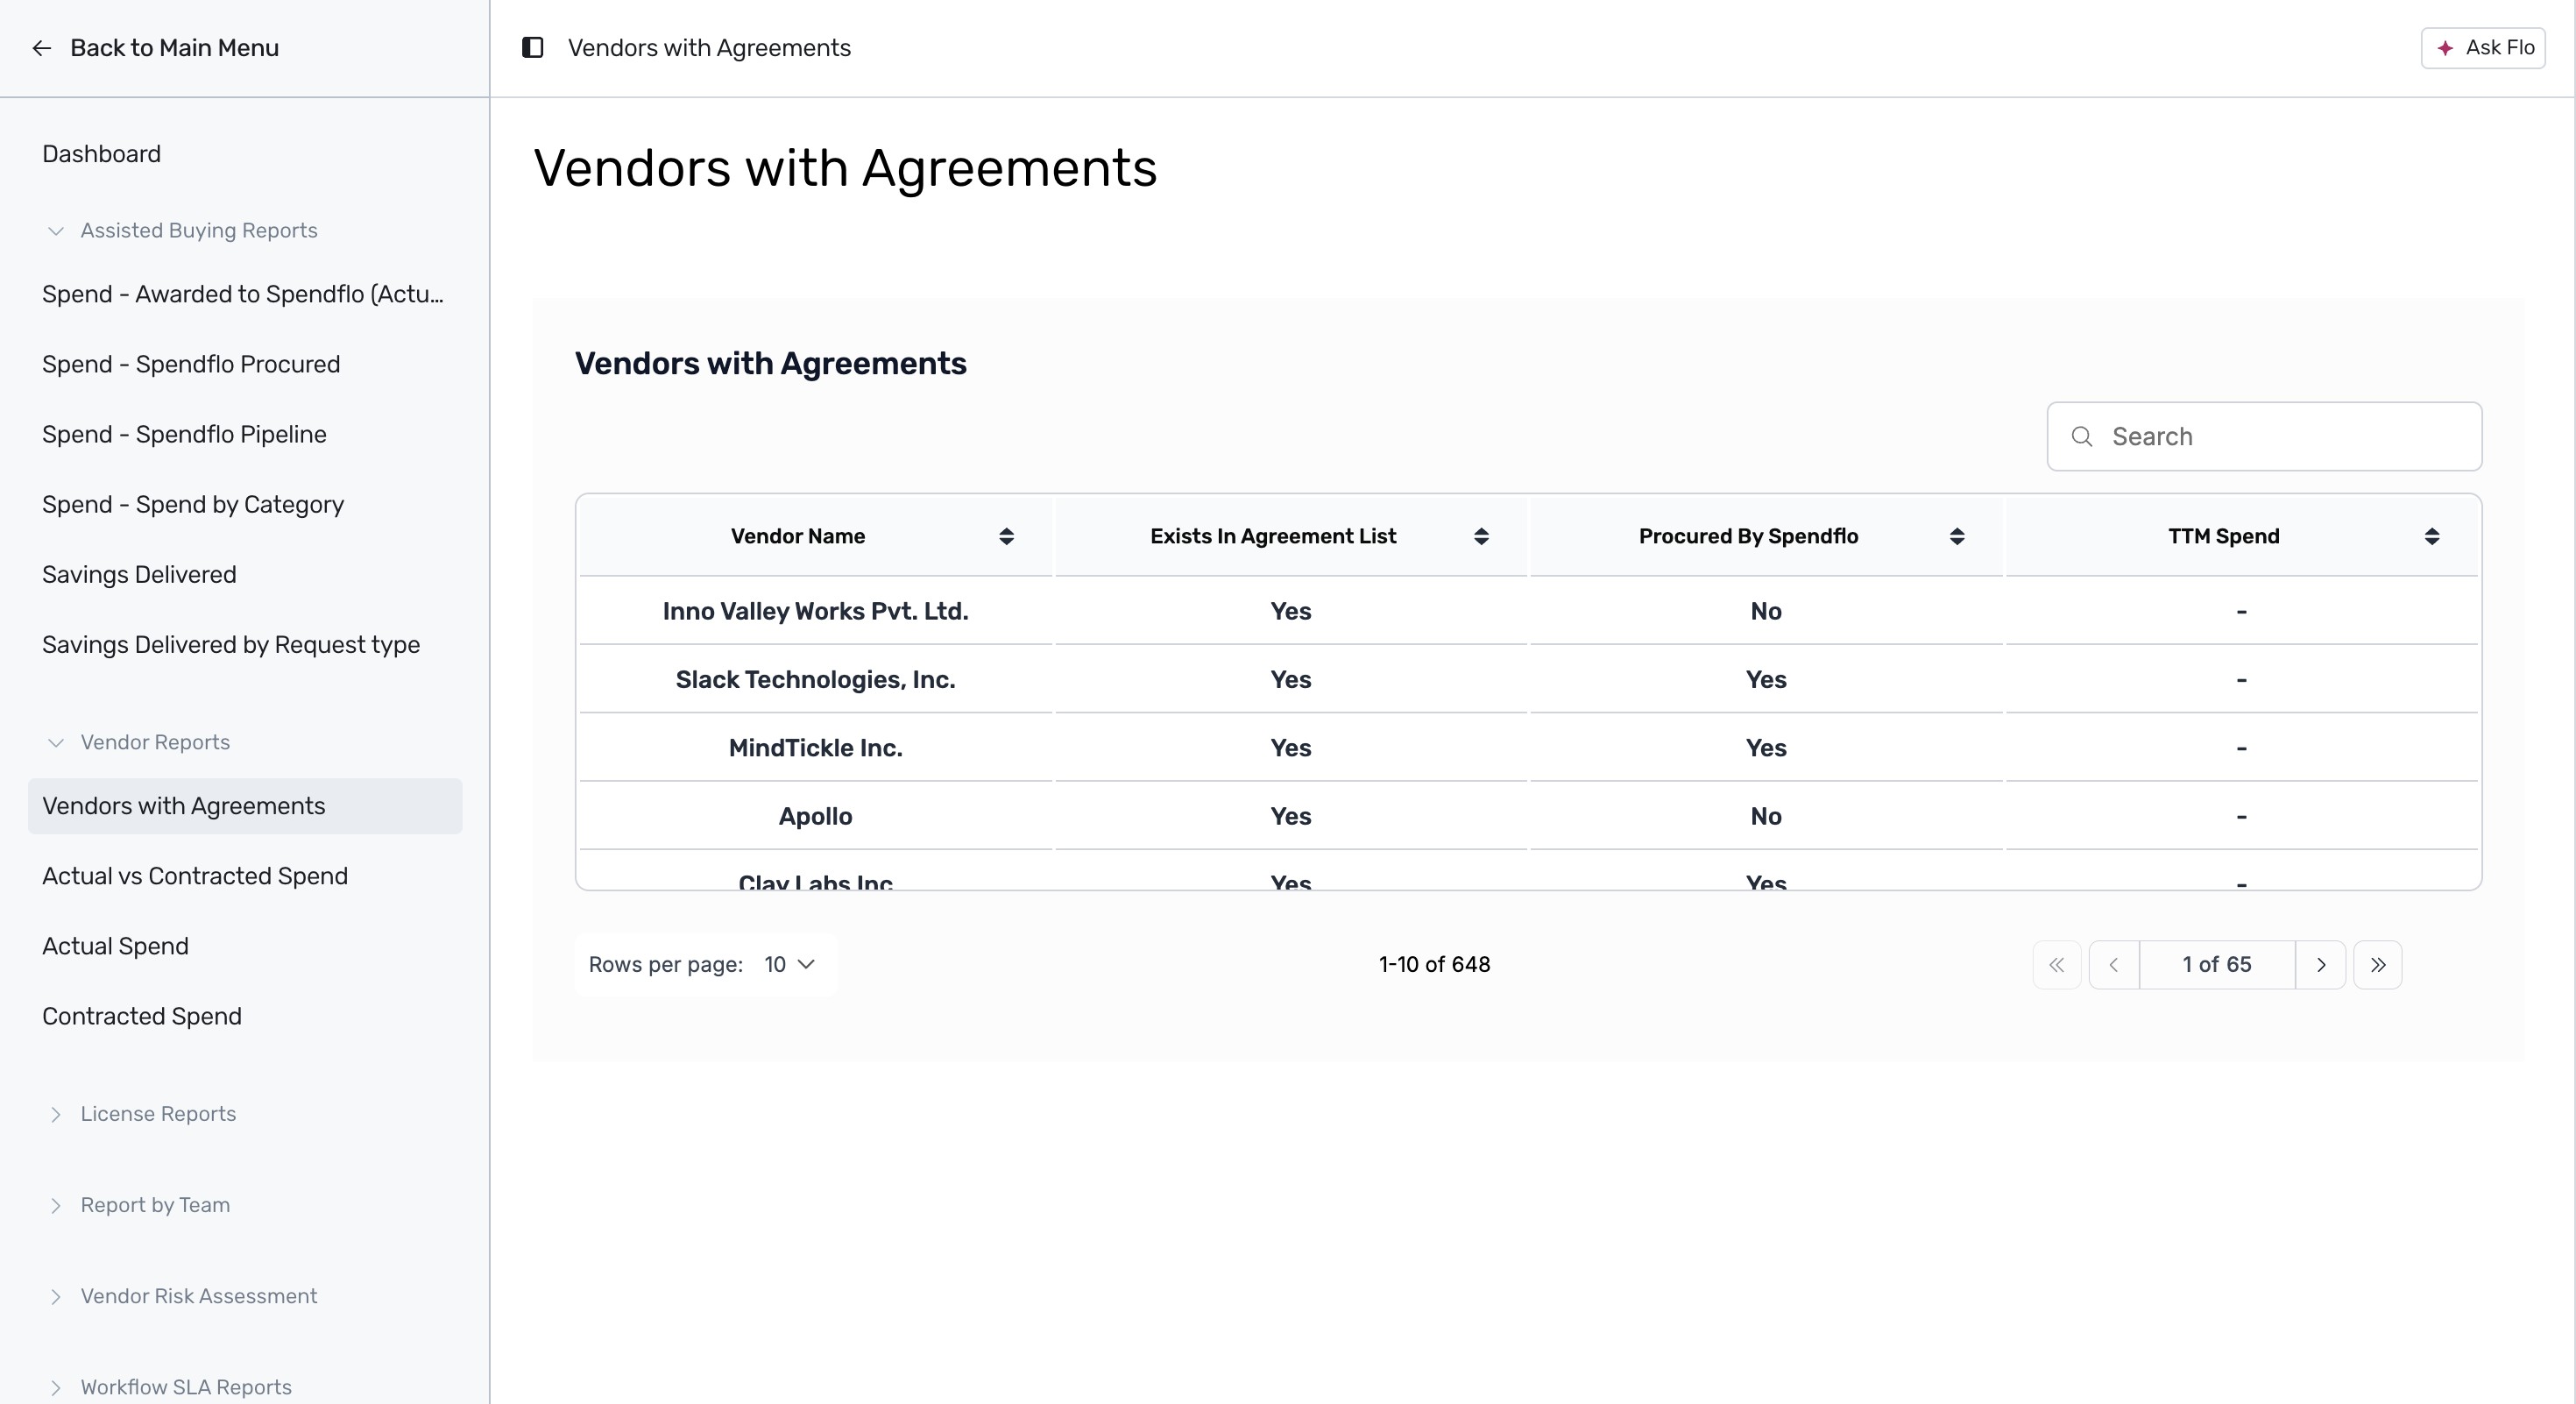
Expand the Vendor Reports section on the left sidebar and click on Vendors with Agreements to view a tabular list of vendors, whether they exist in the agreement list, if they were procured by Spendflo, and their trailing twelve months (TTM) spend.
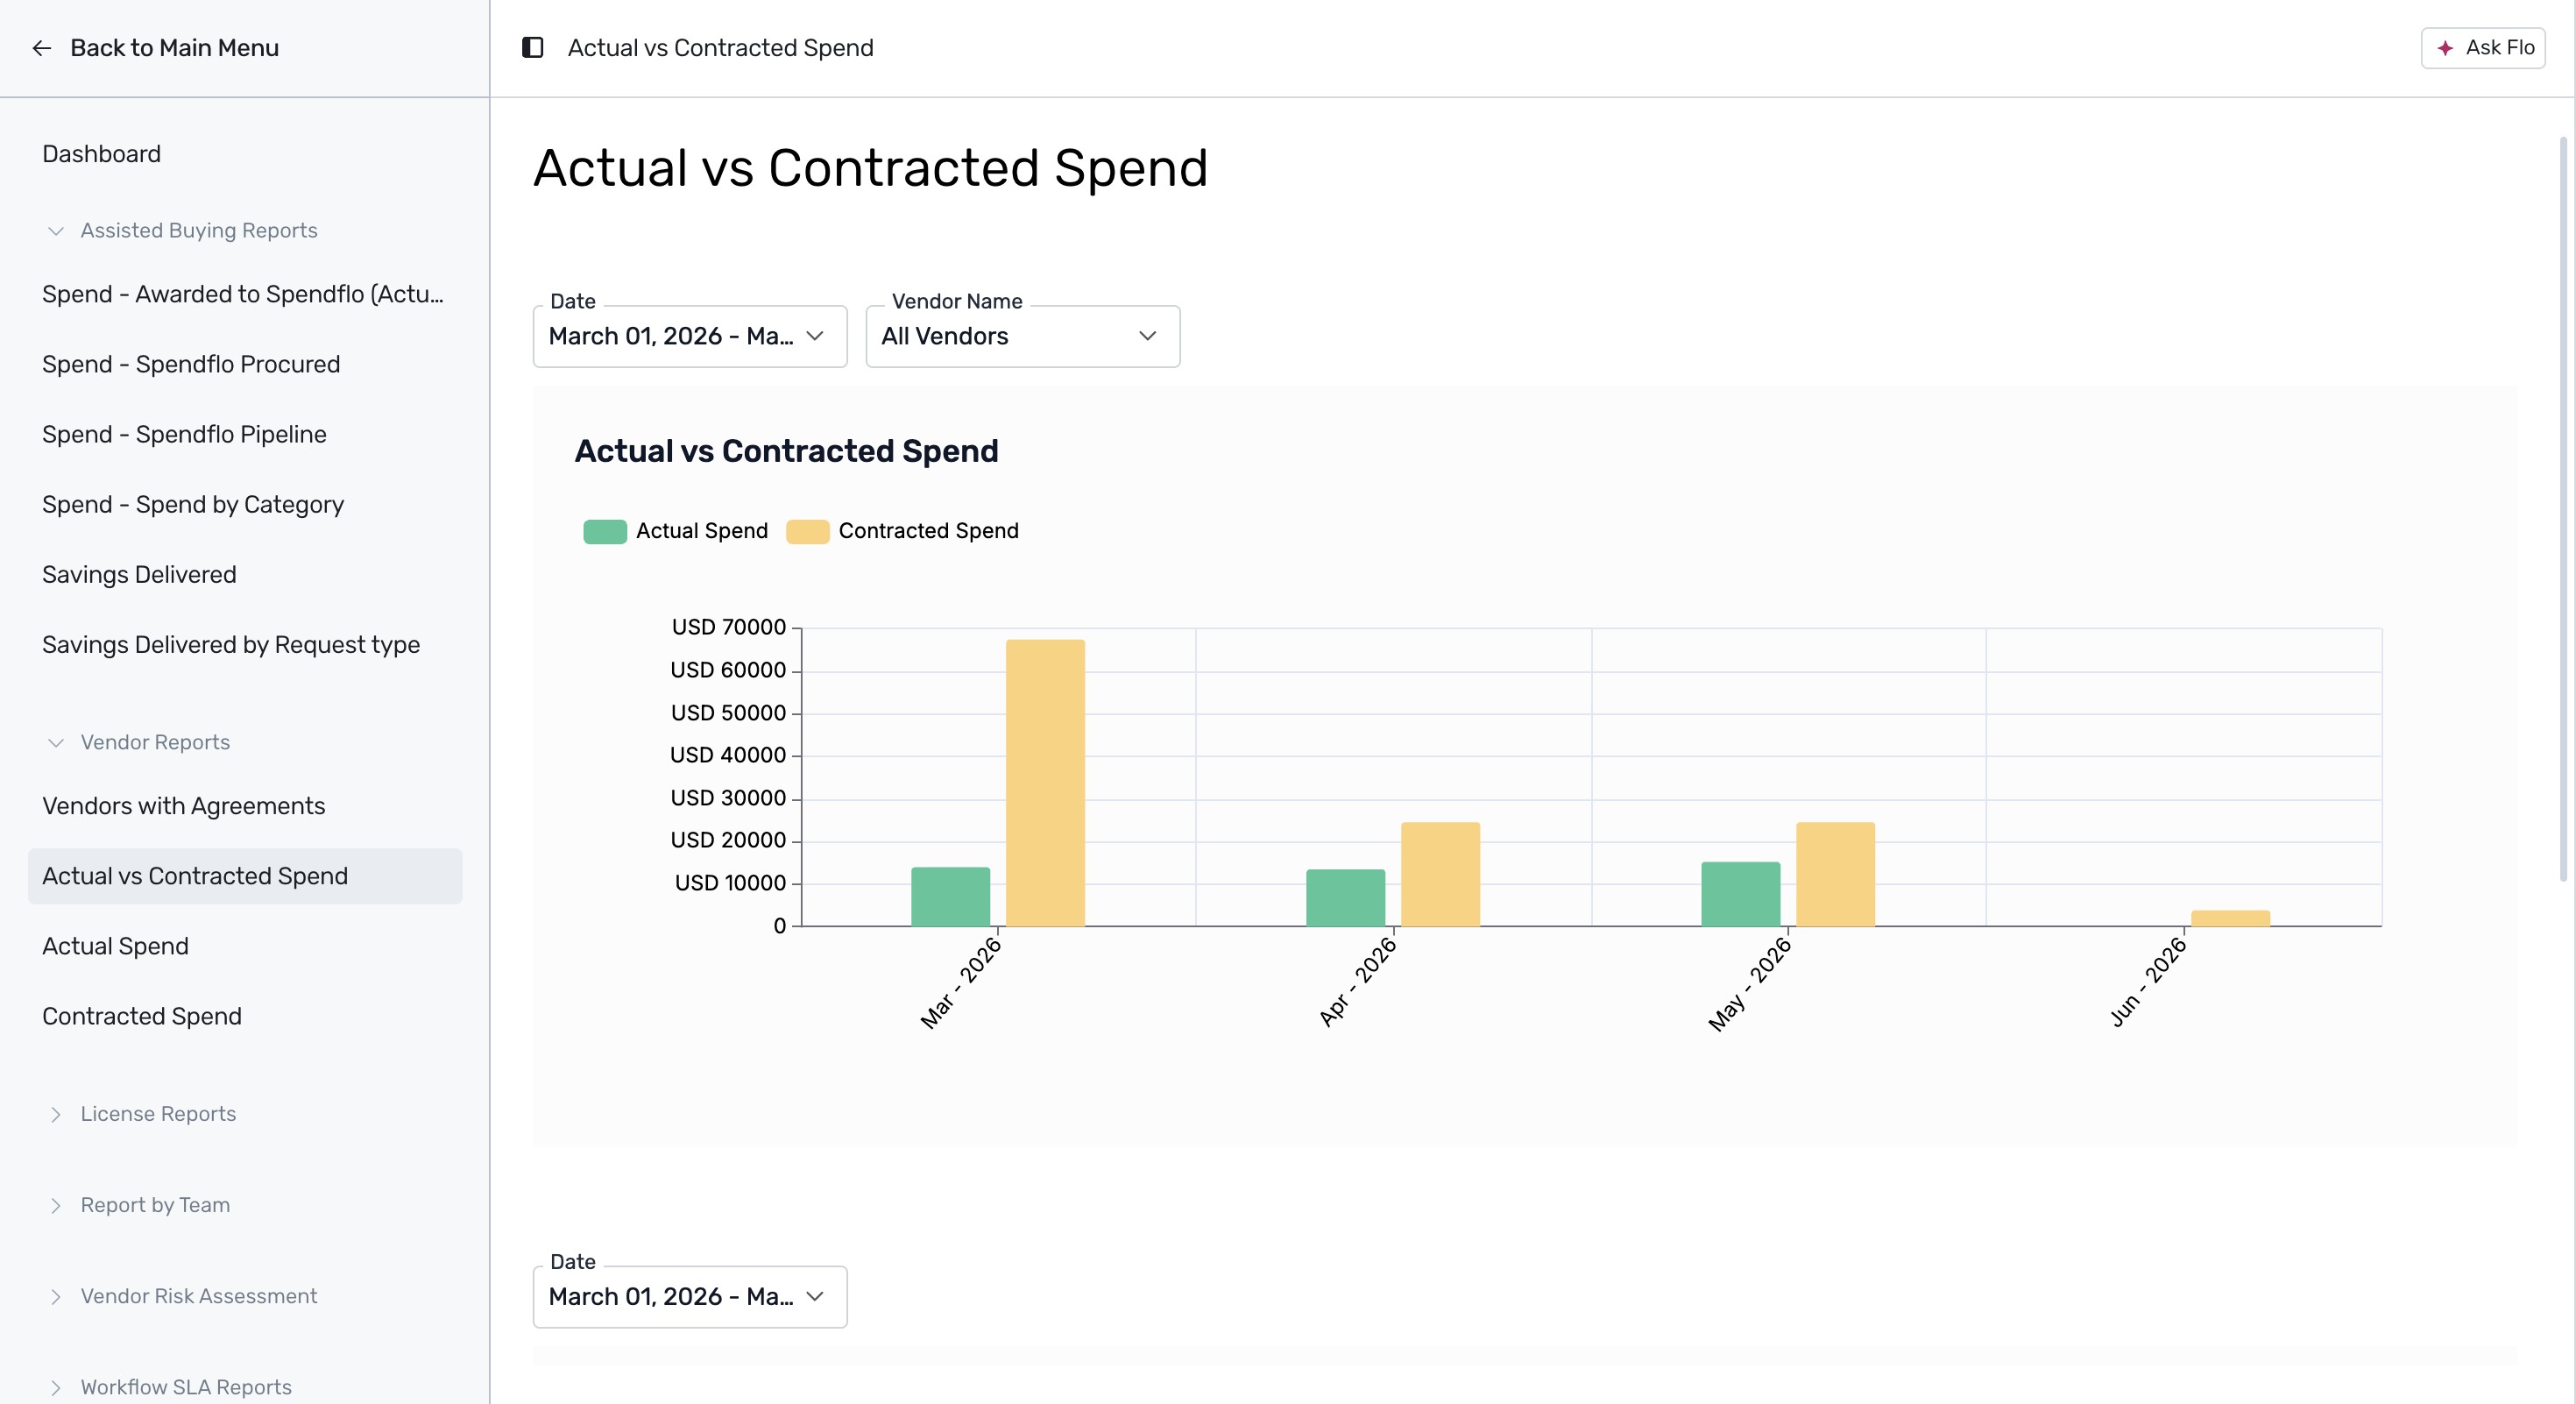
Click on Actual vs Contracted Spend to see a side-by-side comparison bar chart of your actual spend versus contracted spend. This report helps identify discrepancies or overspending. For details on finance integration requirements.
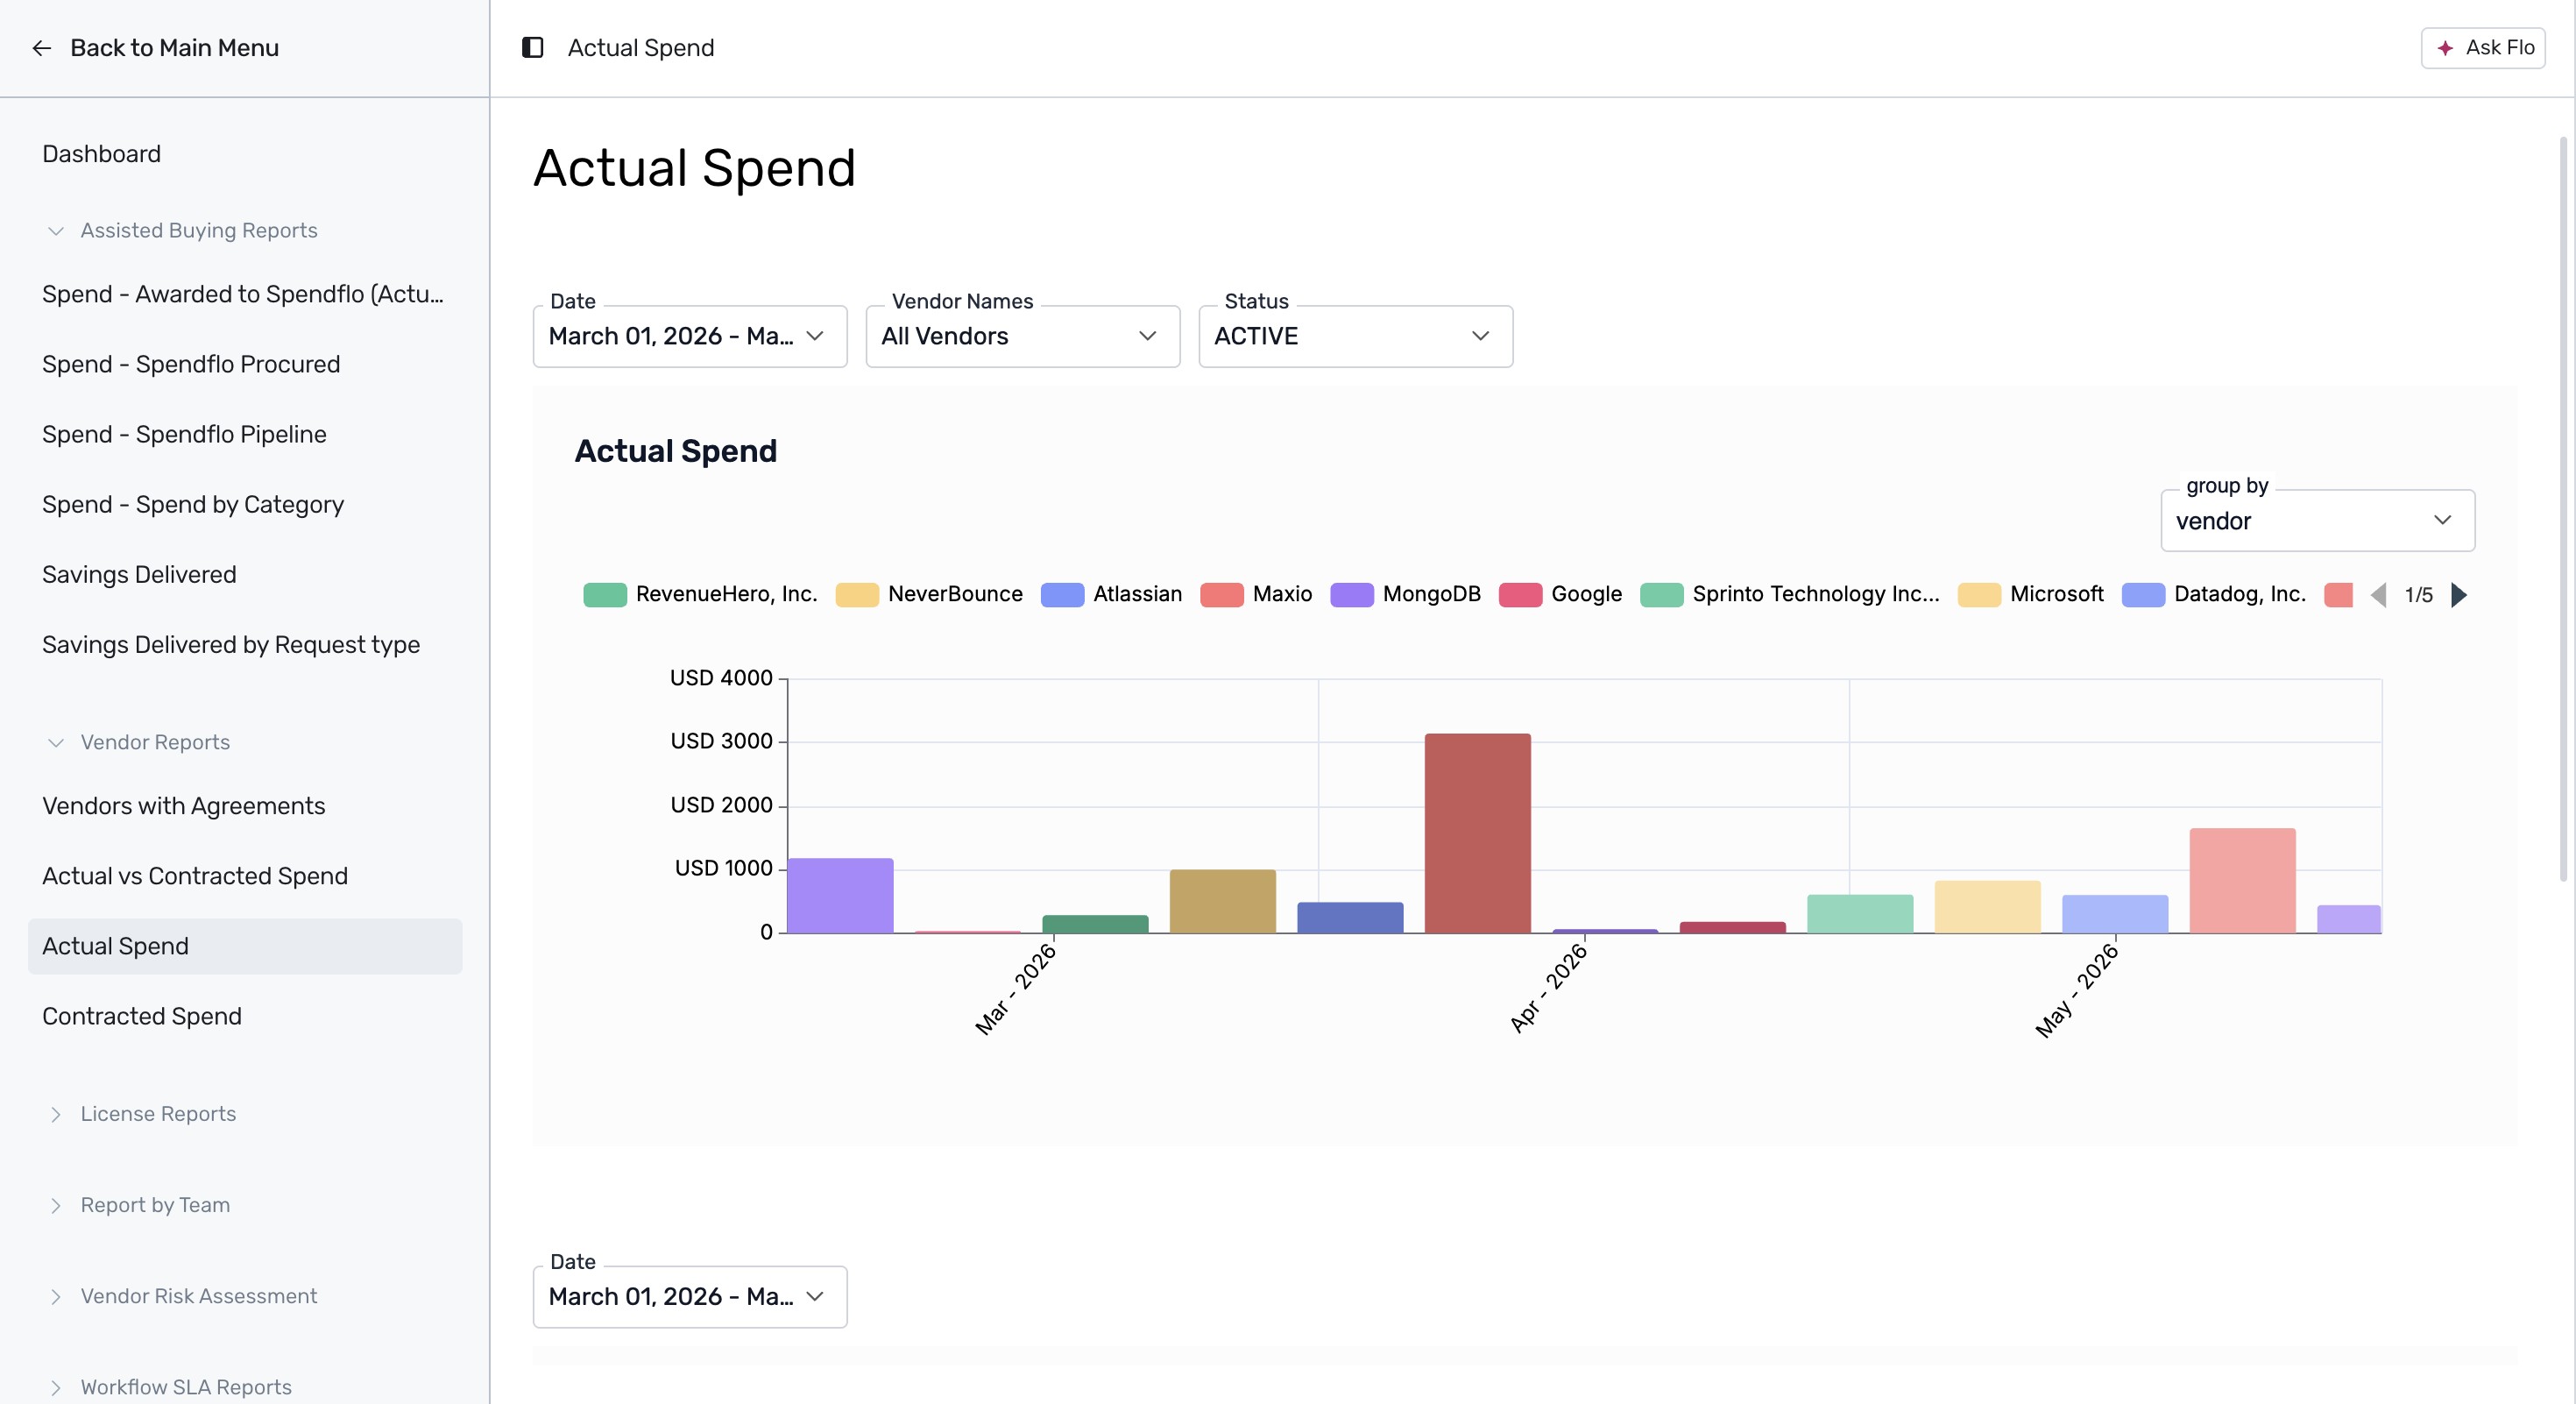
Click on Actual Spend to view a detailed bar chart showing monthly actual spend grouped by vendor.
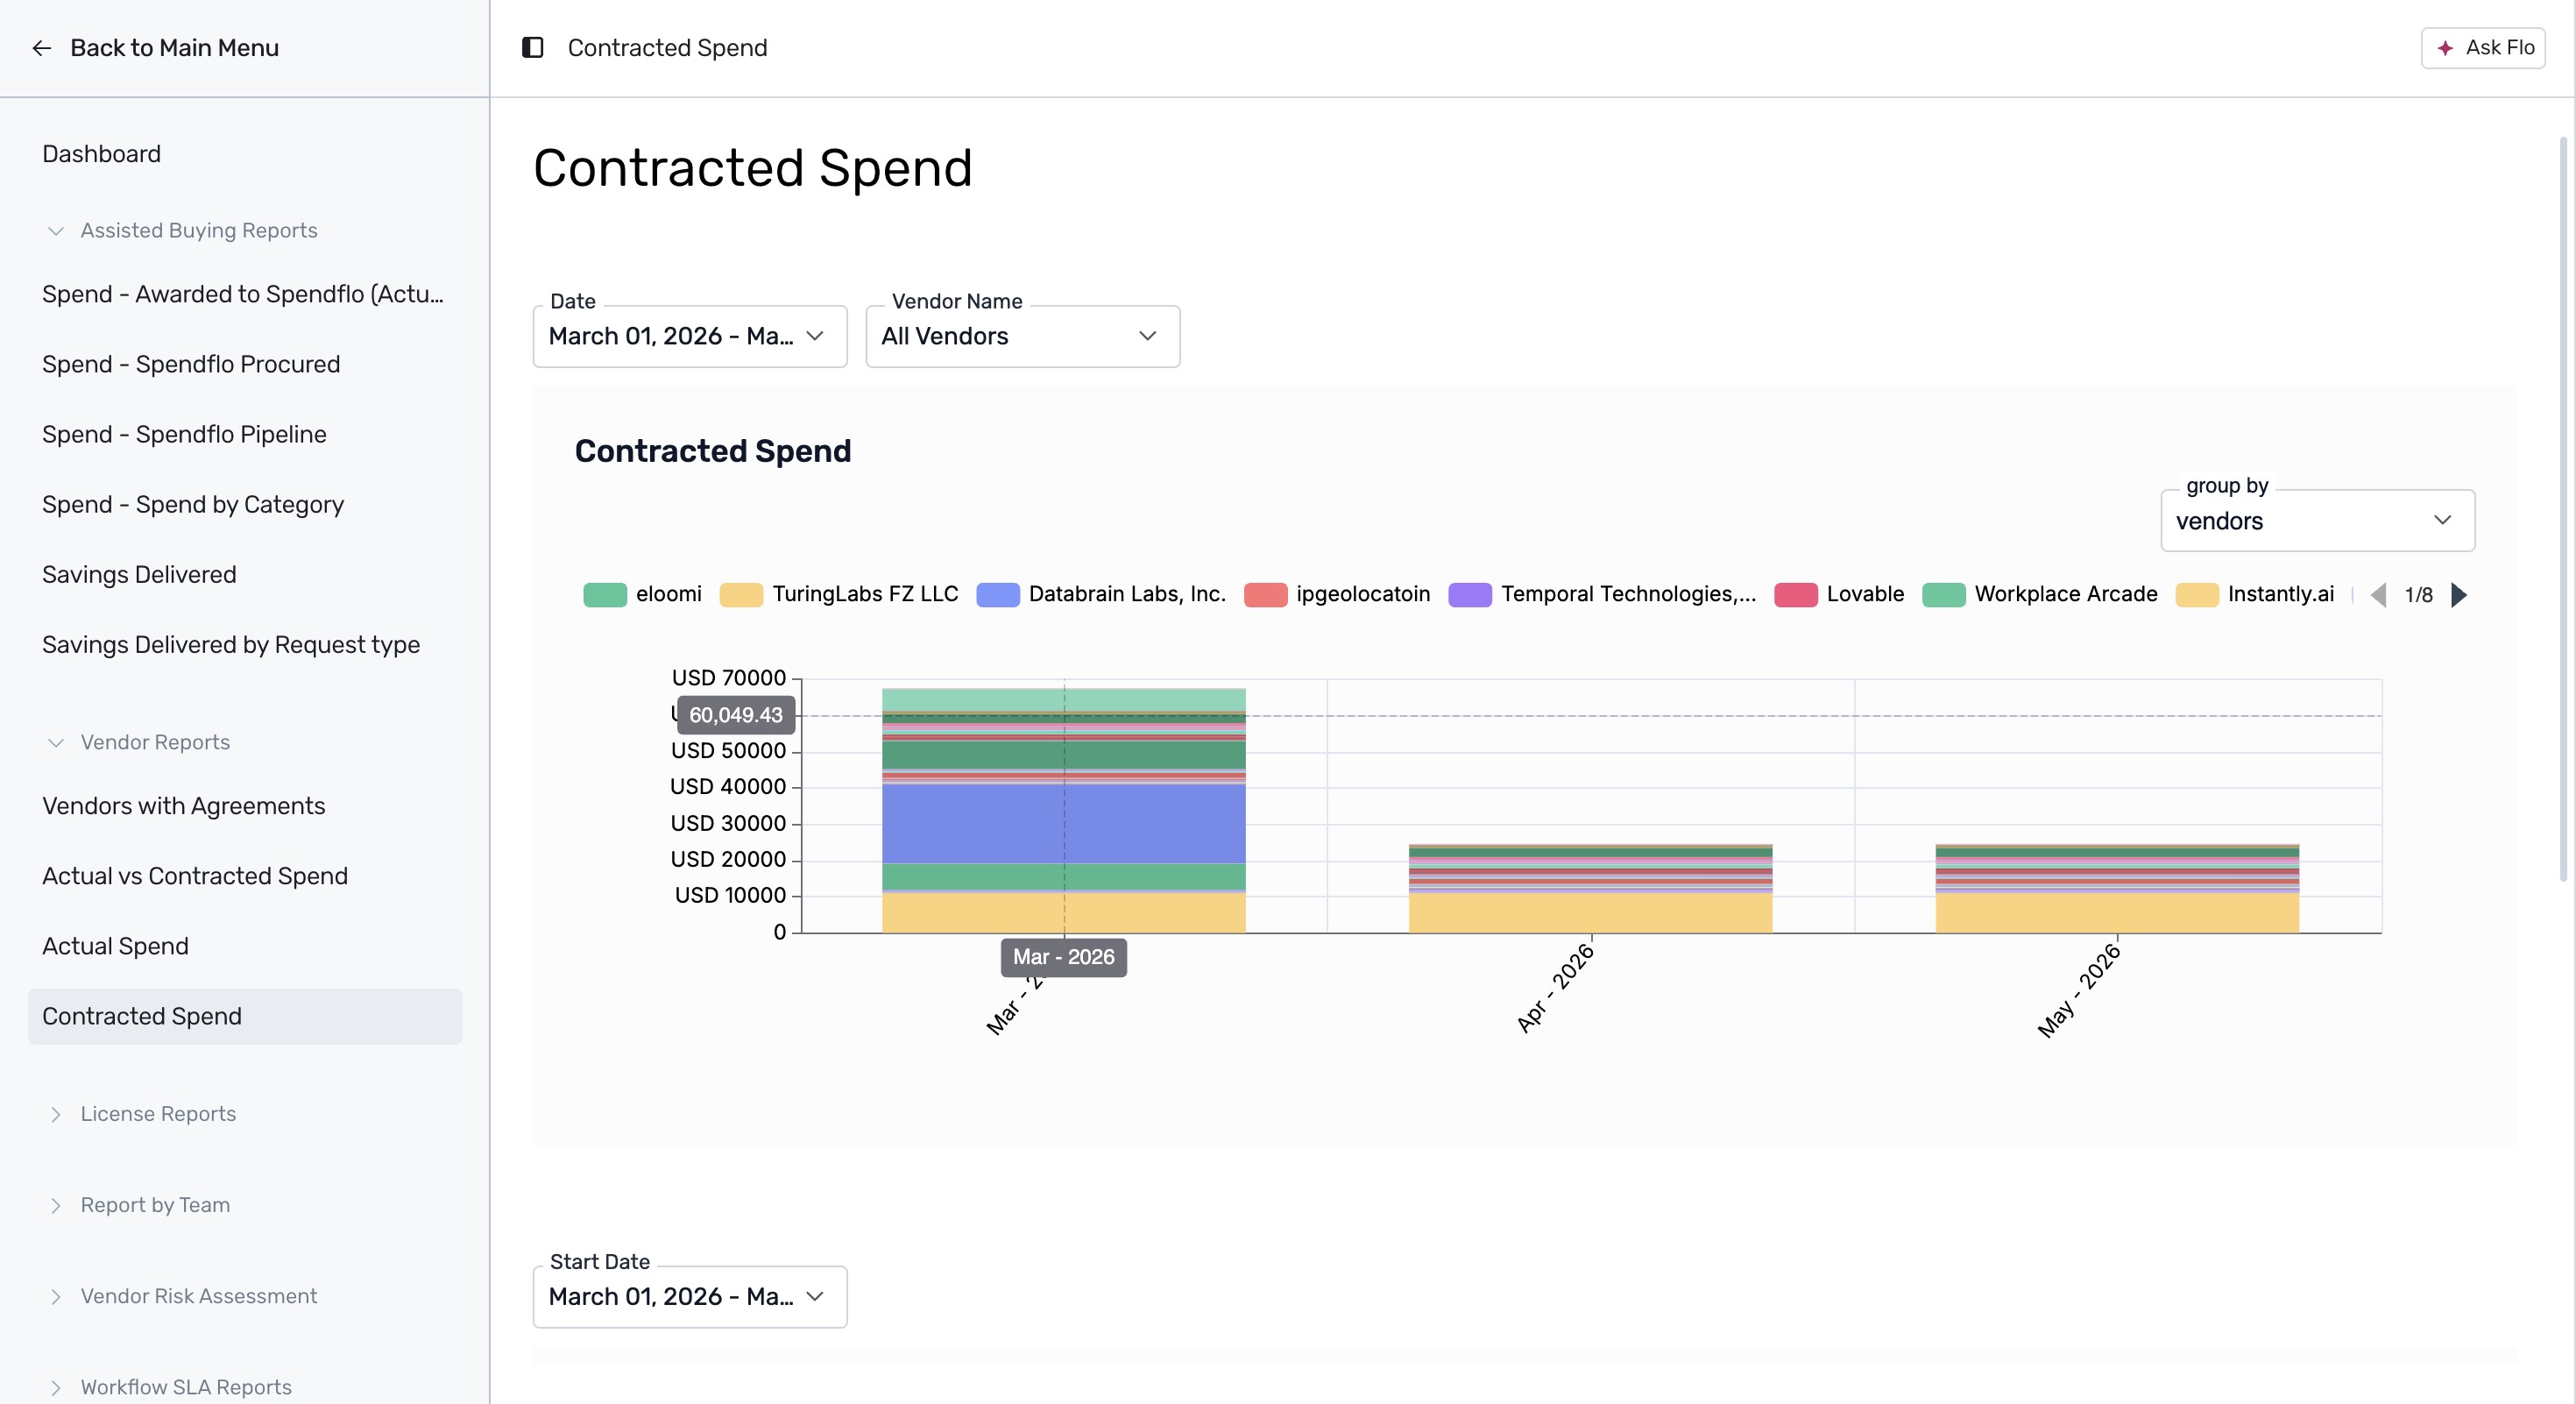
Click on Contracted Spend to view a monthly breakdown of your contracted spend stacked by vendor.
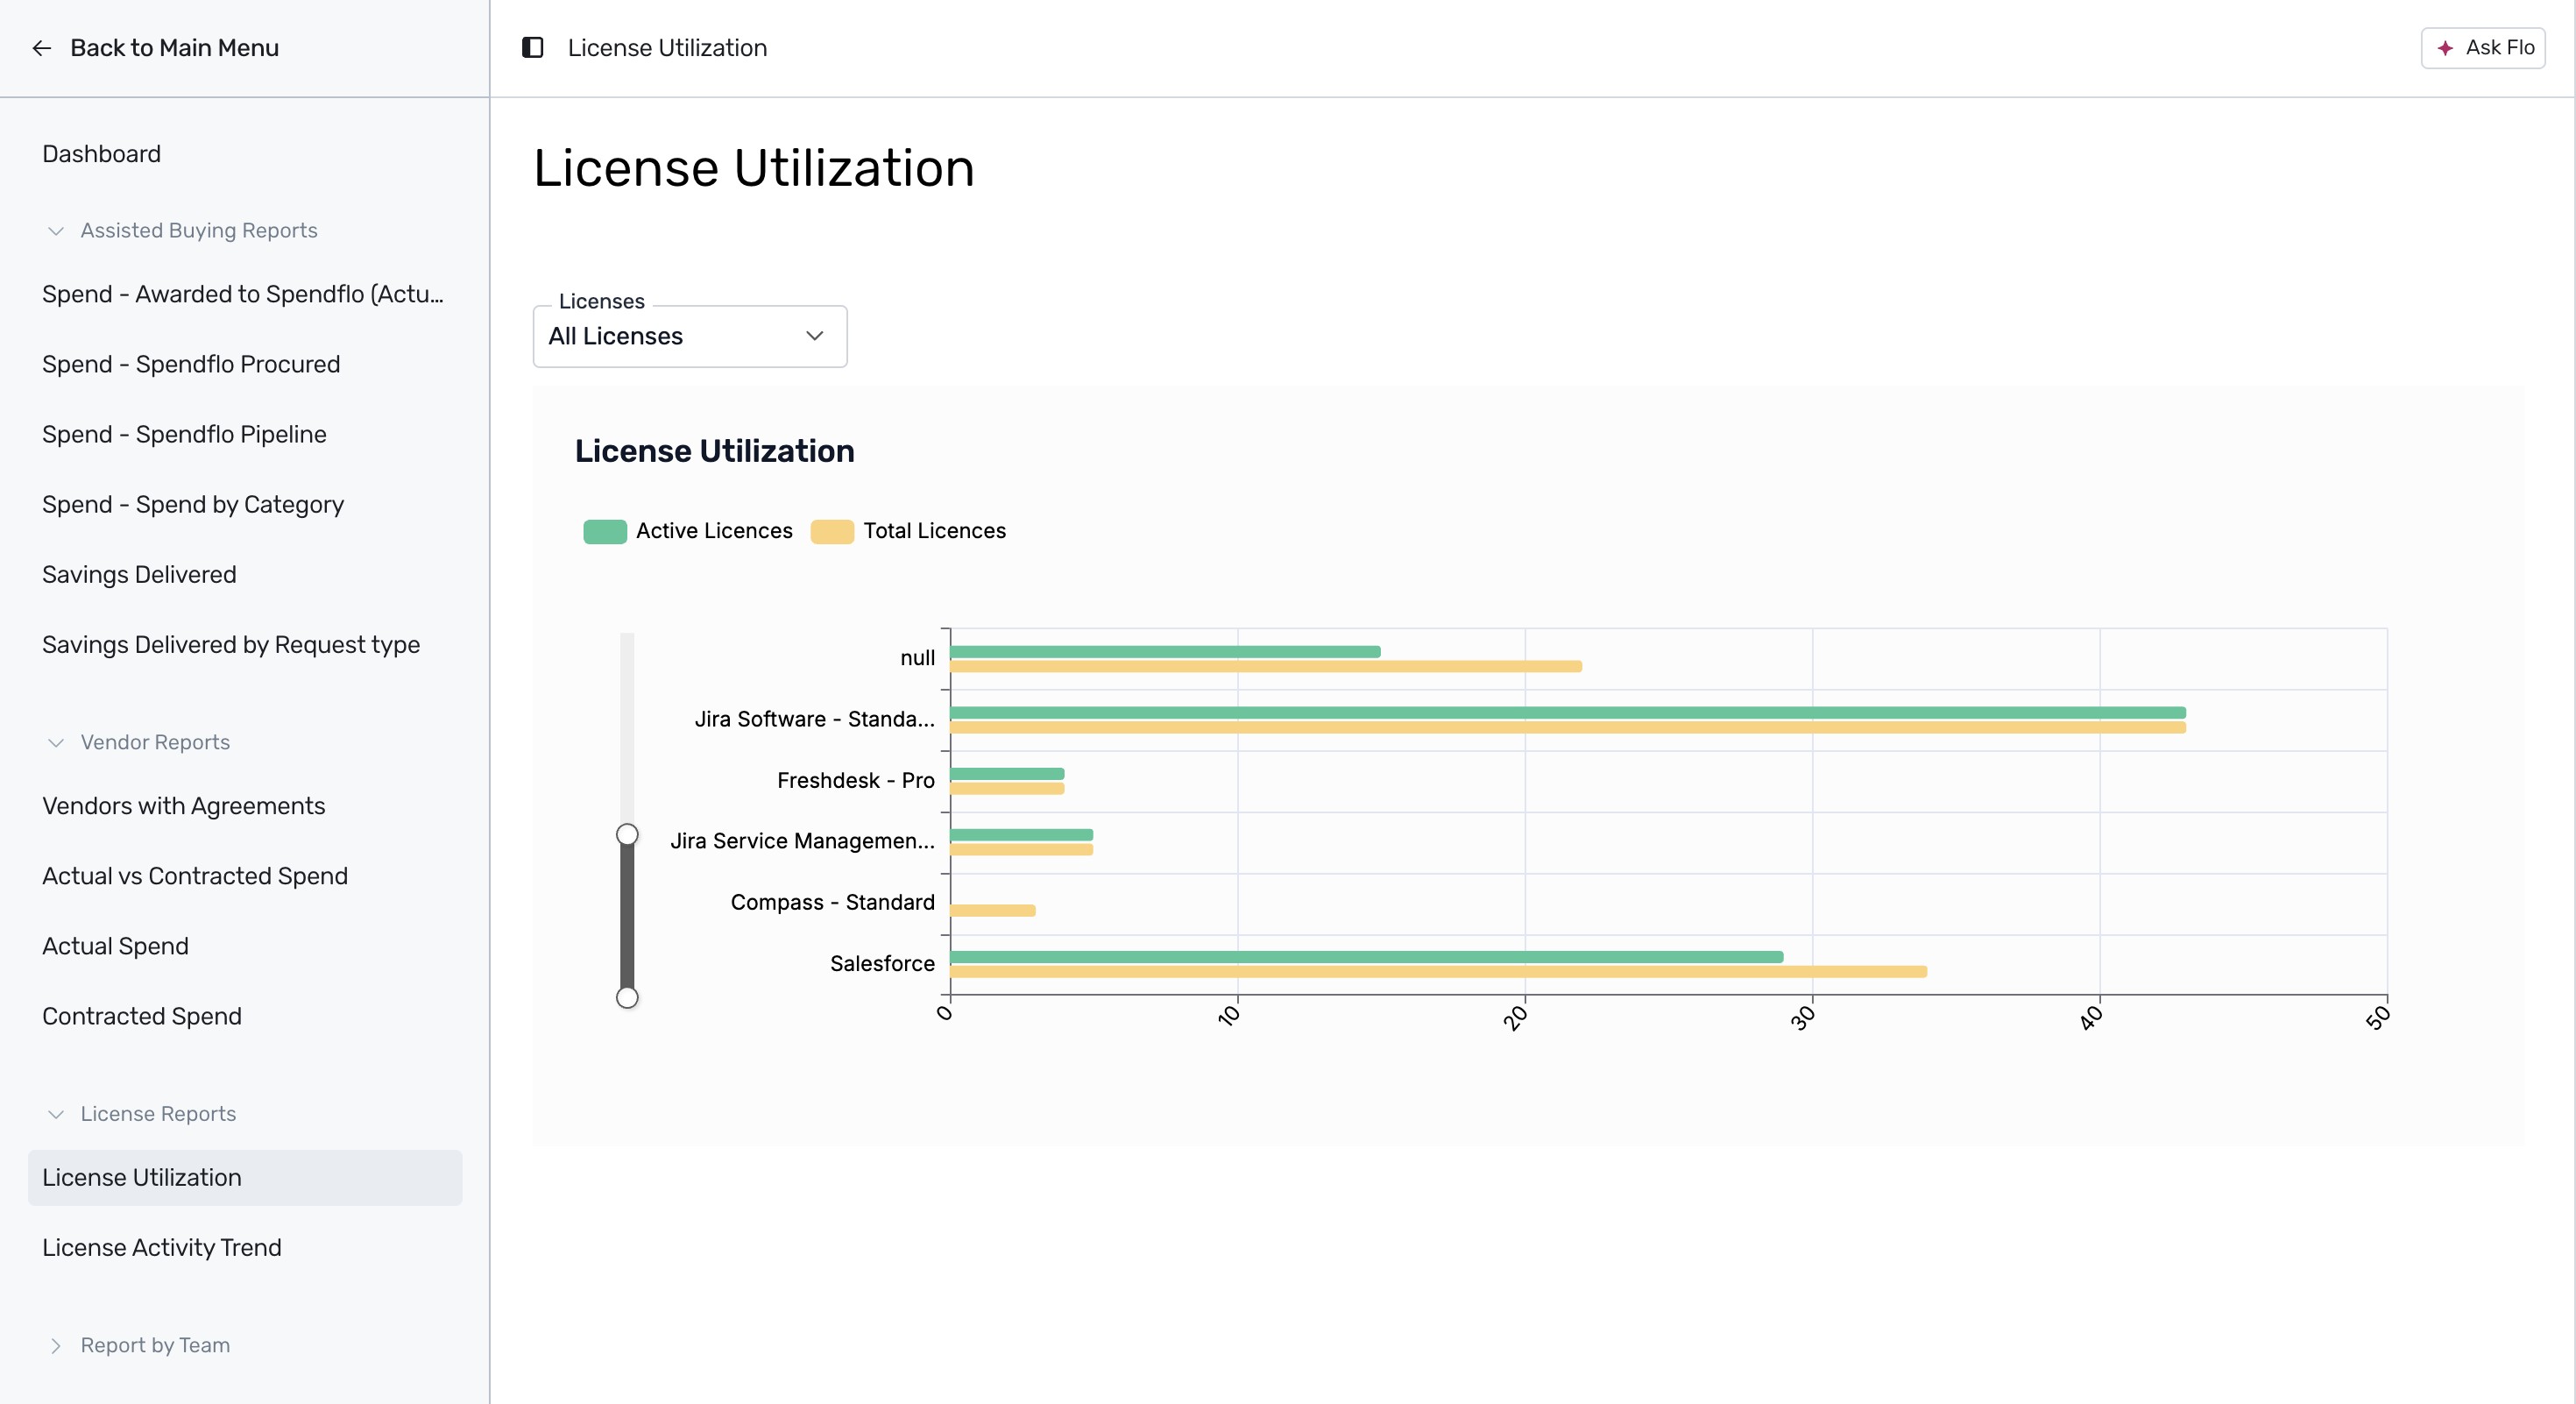
Expand the License Reports section on the left sidebar and click on License Utilization to view a comparison of active versus total licenses across your software stack. This helps you identify underutilized licenses.
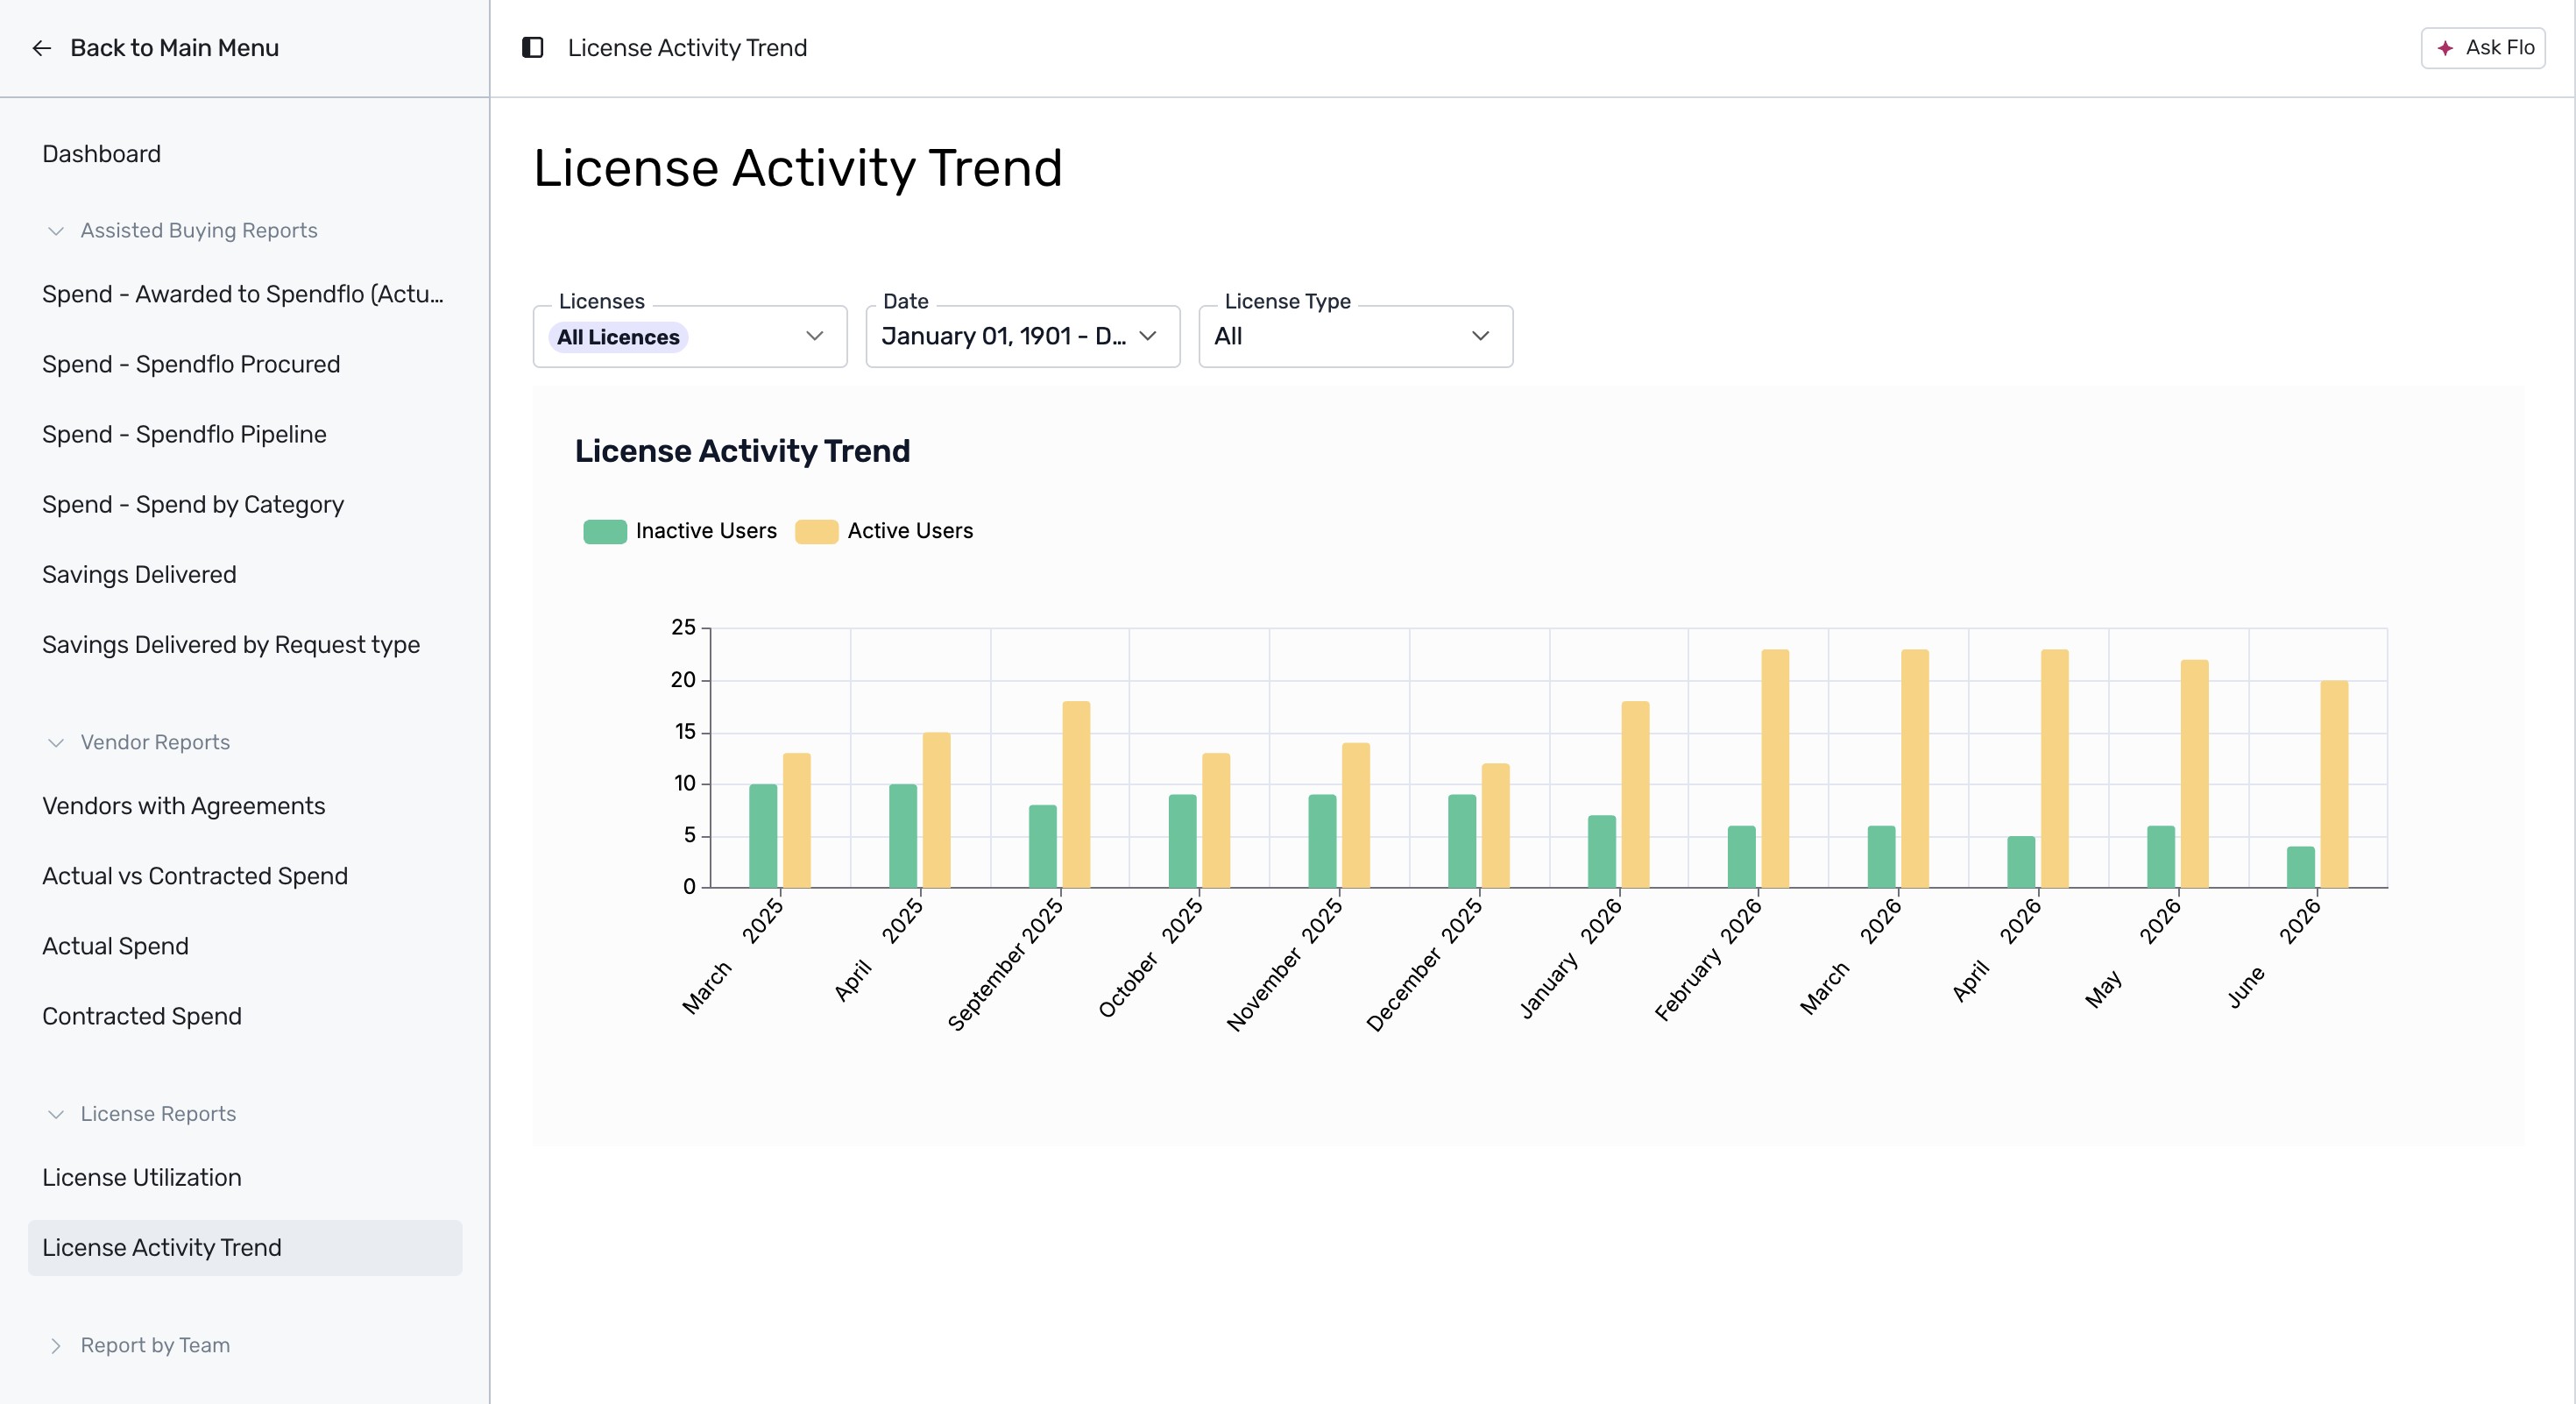
Click on License Activity Trend to view a historical monthly bar chart comparing active and inactive users across your applications.
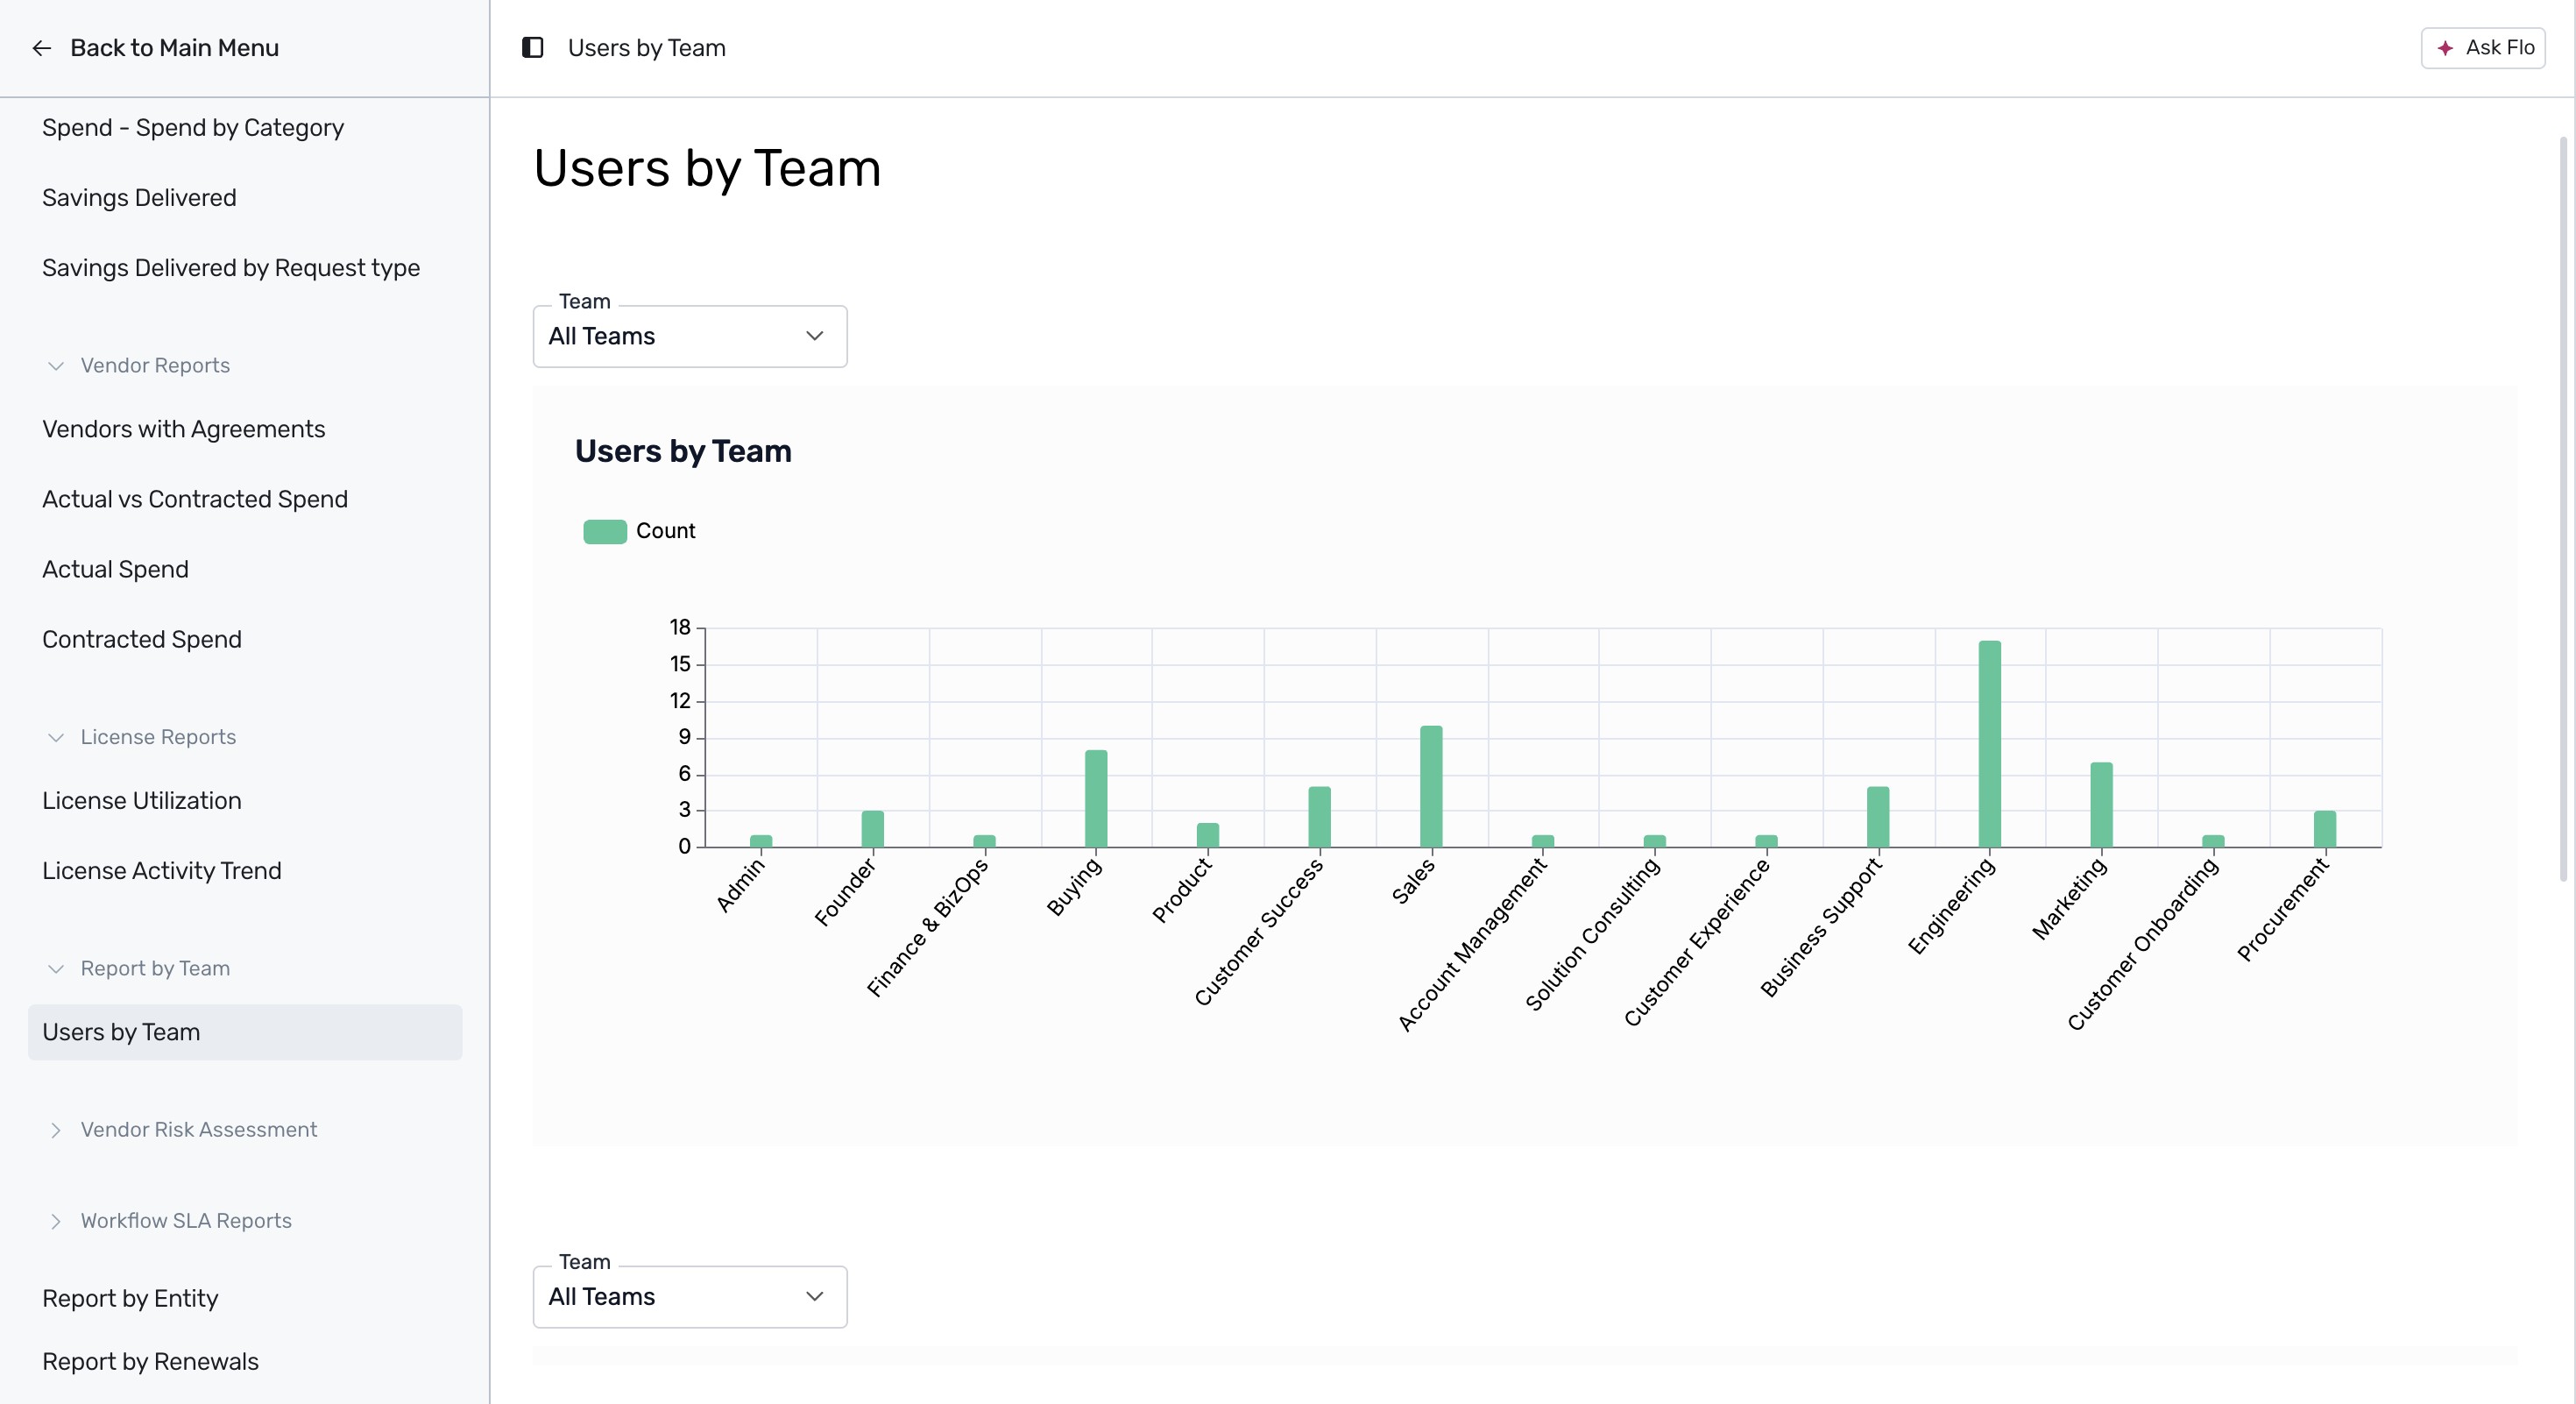
Expand the Report by Team section and click on Users by Team to view a bar chart showing the distribution of users across different departments or teams.
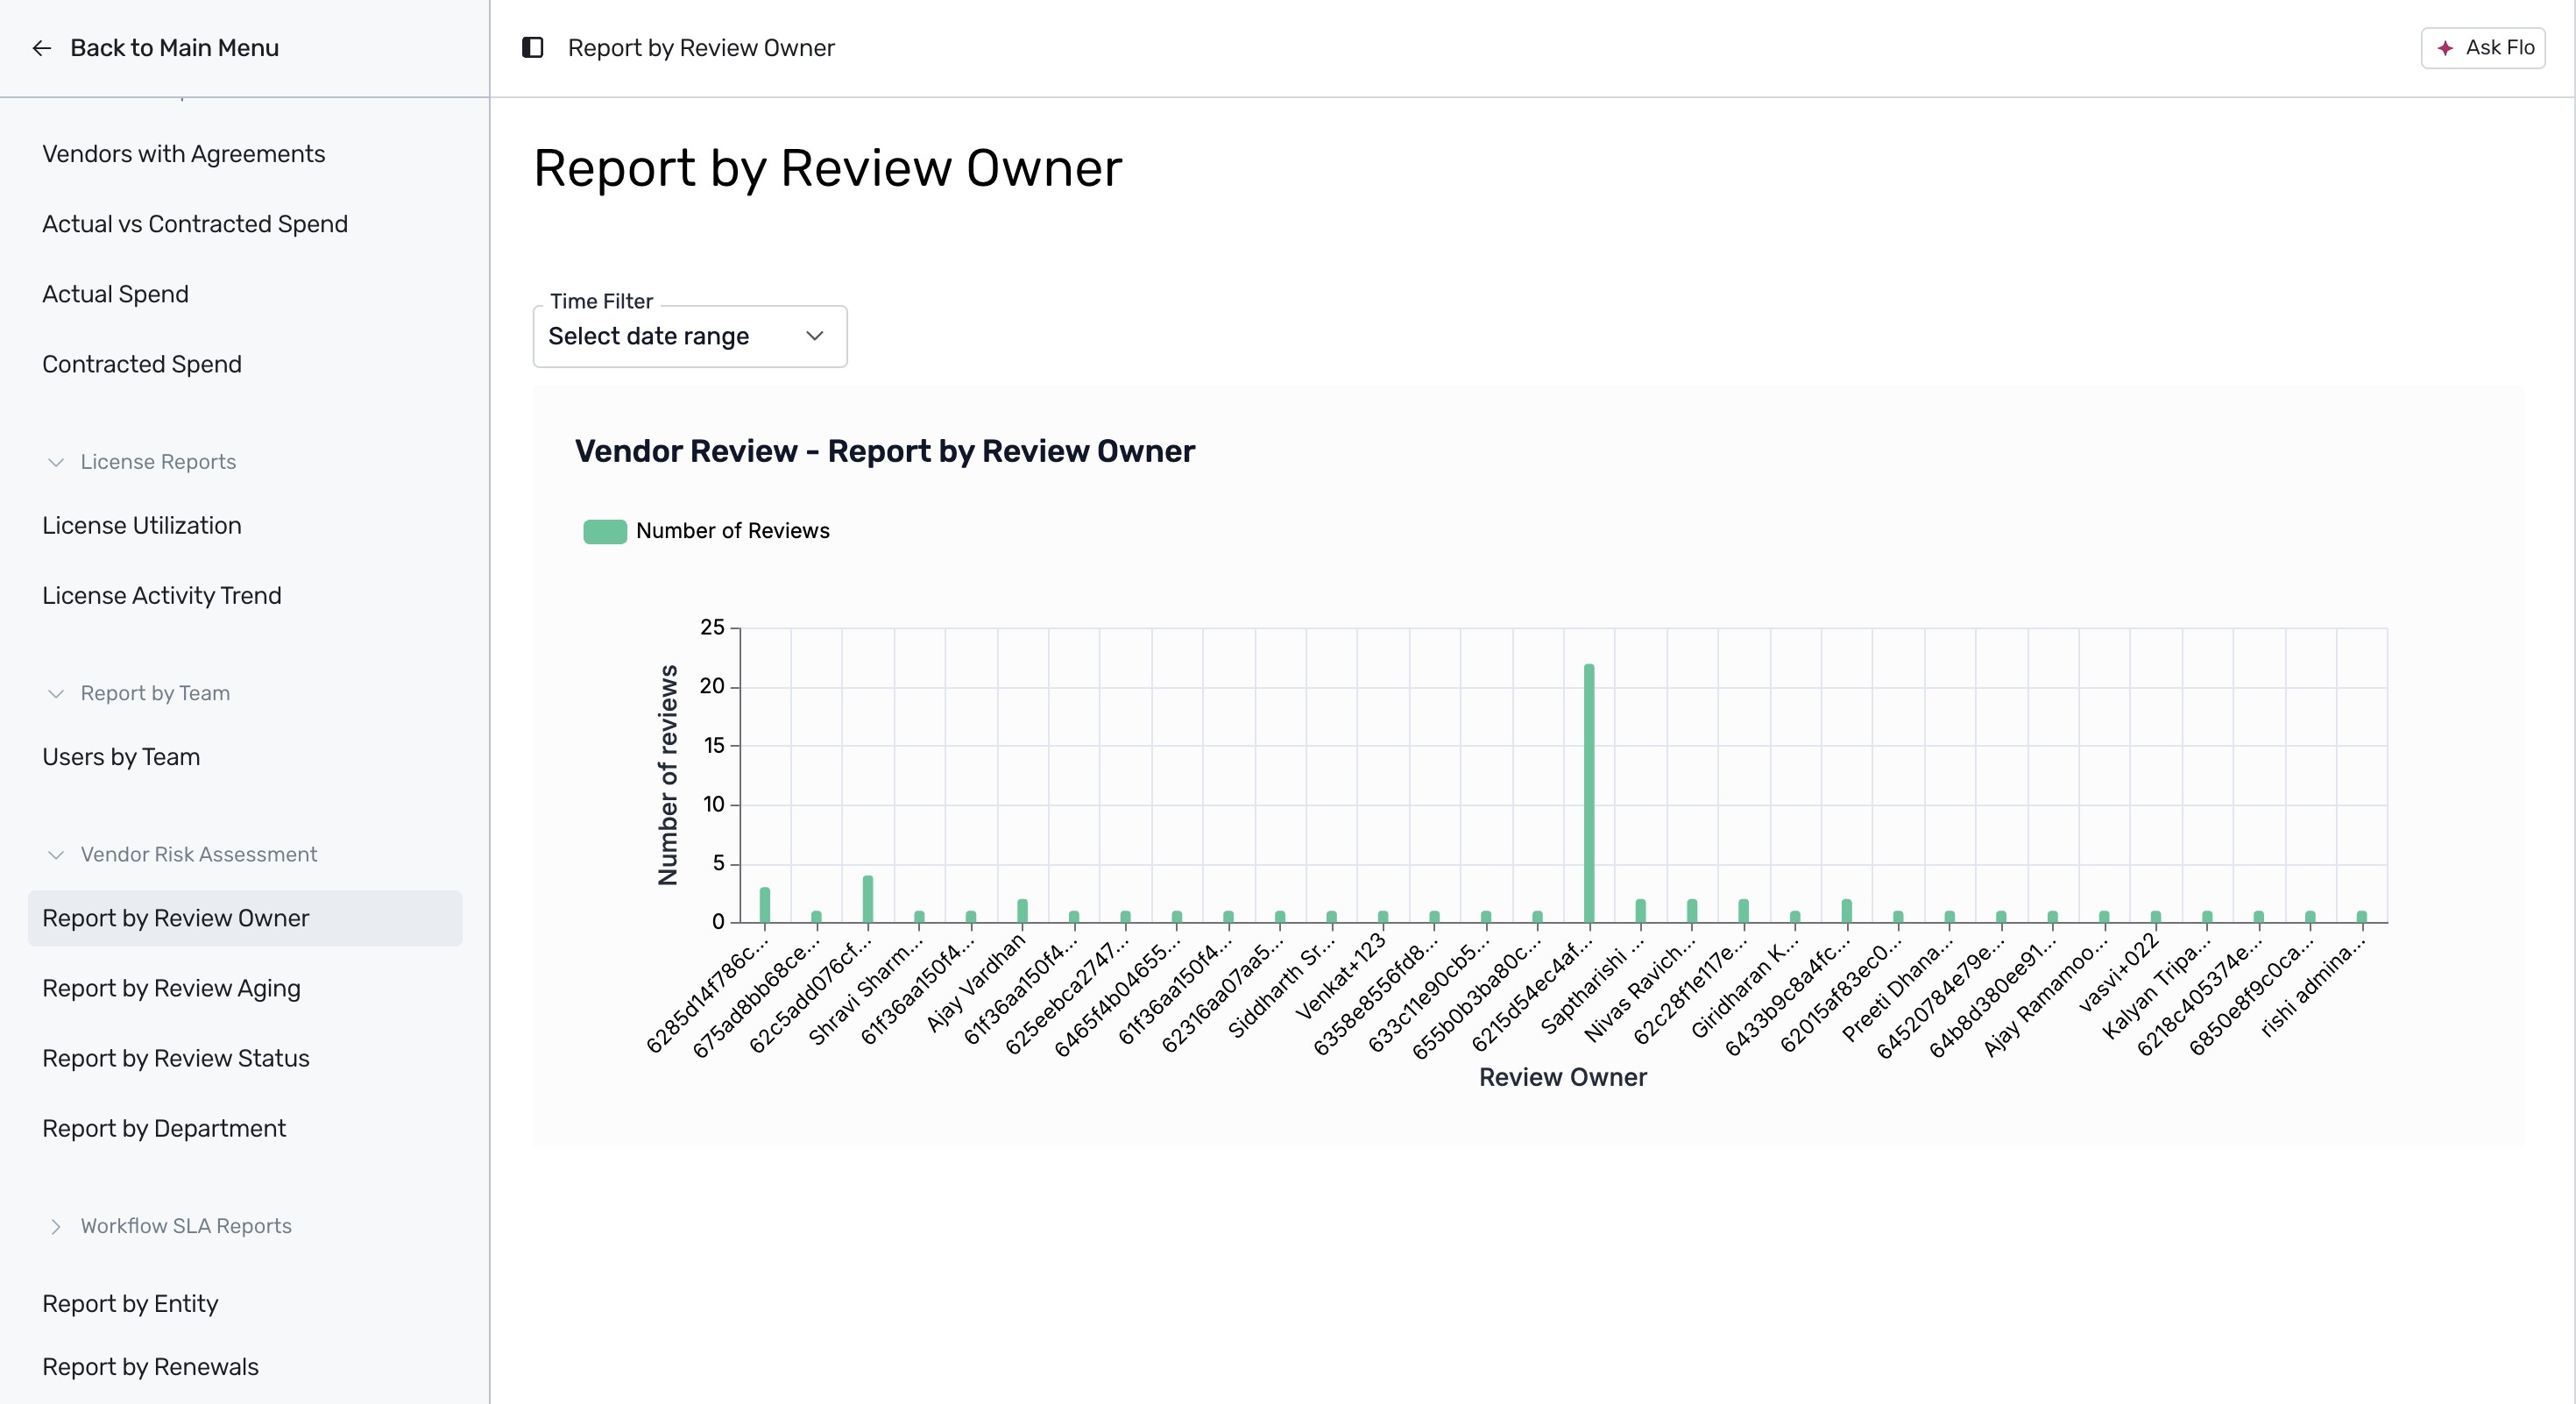
Expand the Vendor Risk Assessment section and click on Report by Review Owner to view the number of vendor risk reviews assigned to each owner. For more information on conducting assessments.
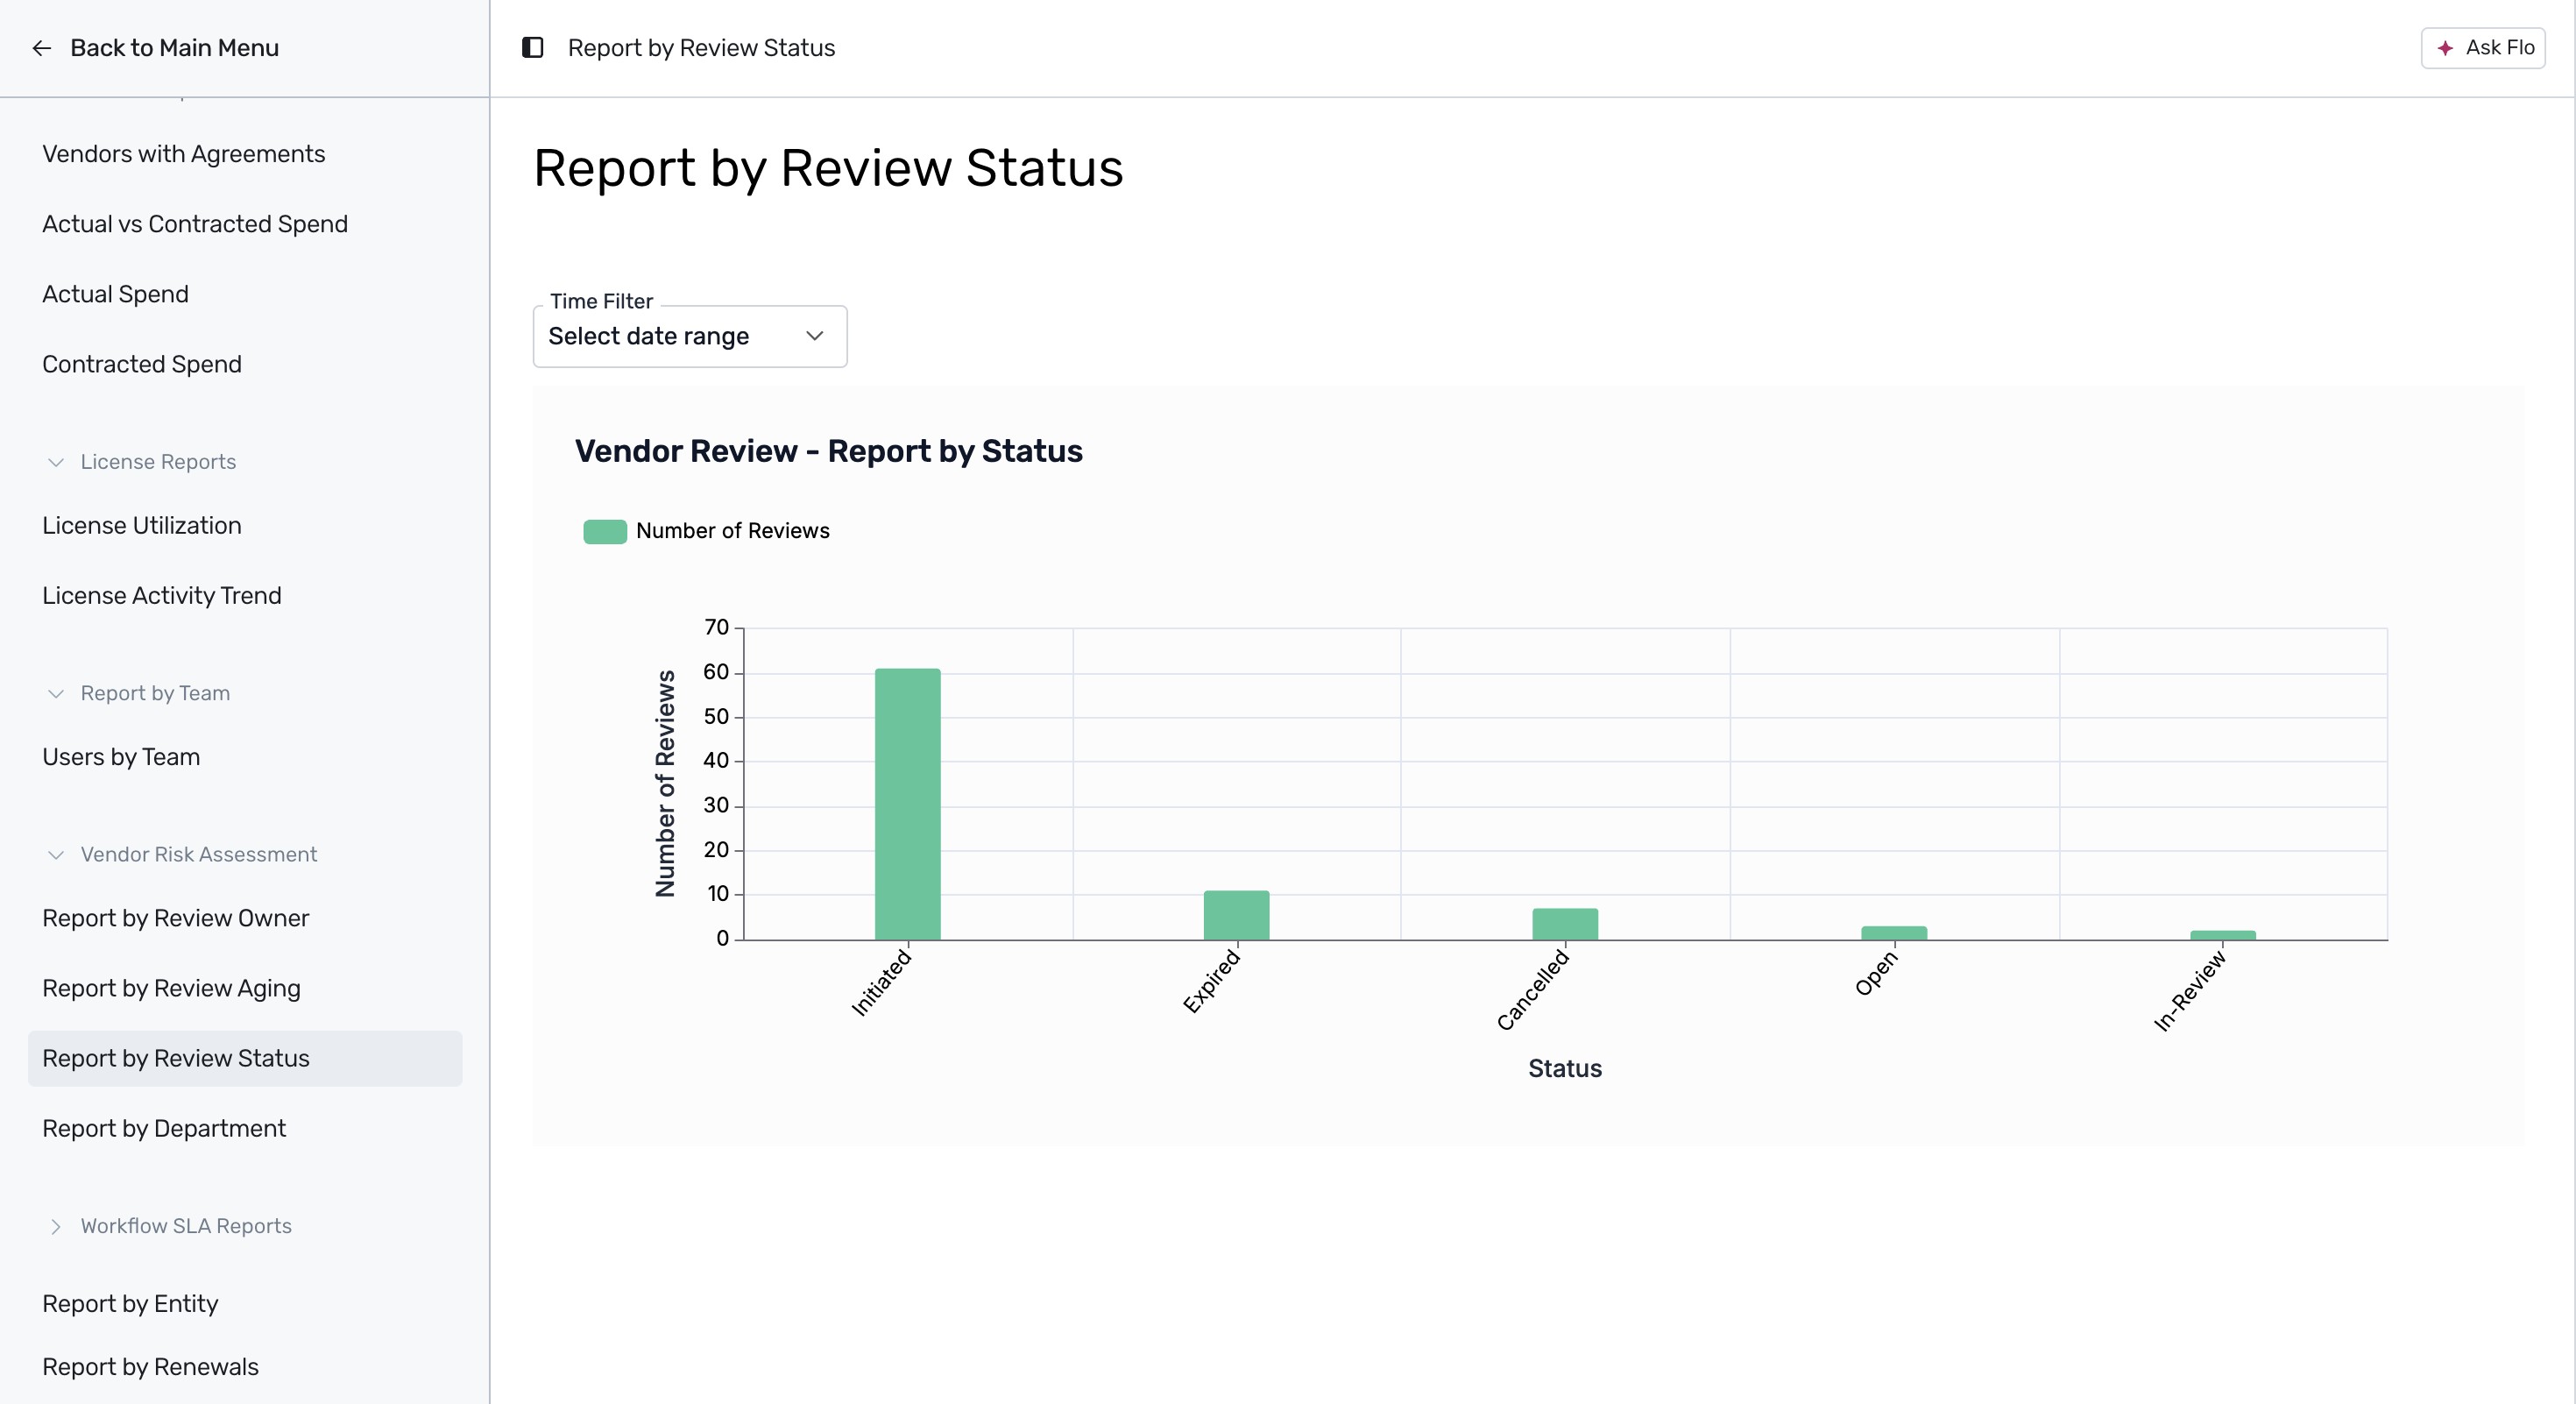
Click on Report by Review Status to view a bar chart illustrating the distribution of reviews across different statuses like Initiated, Expired, Cancelled, Open, and In-Review.
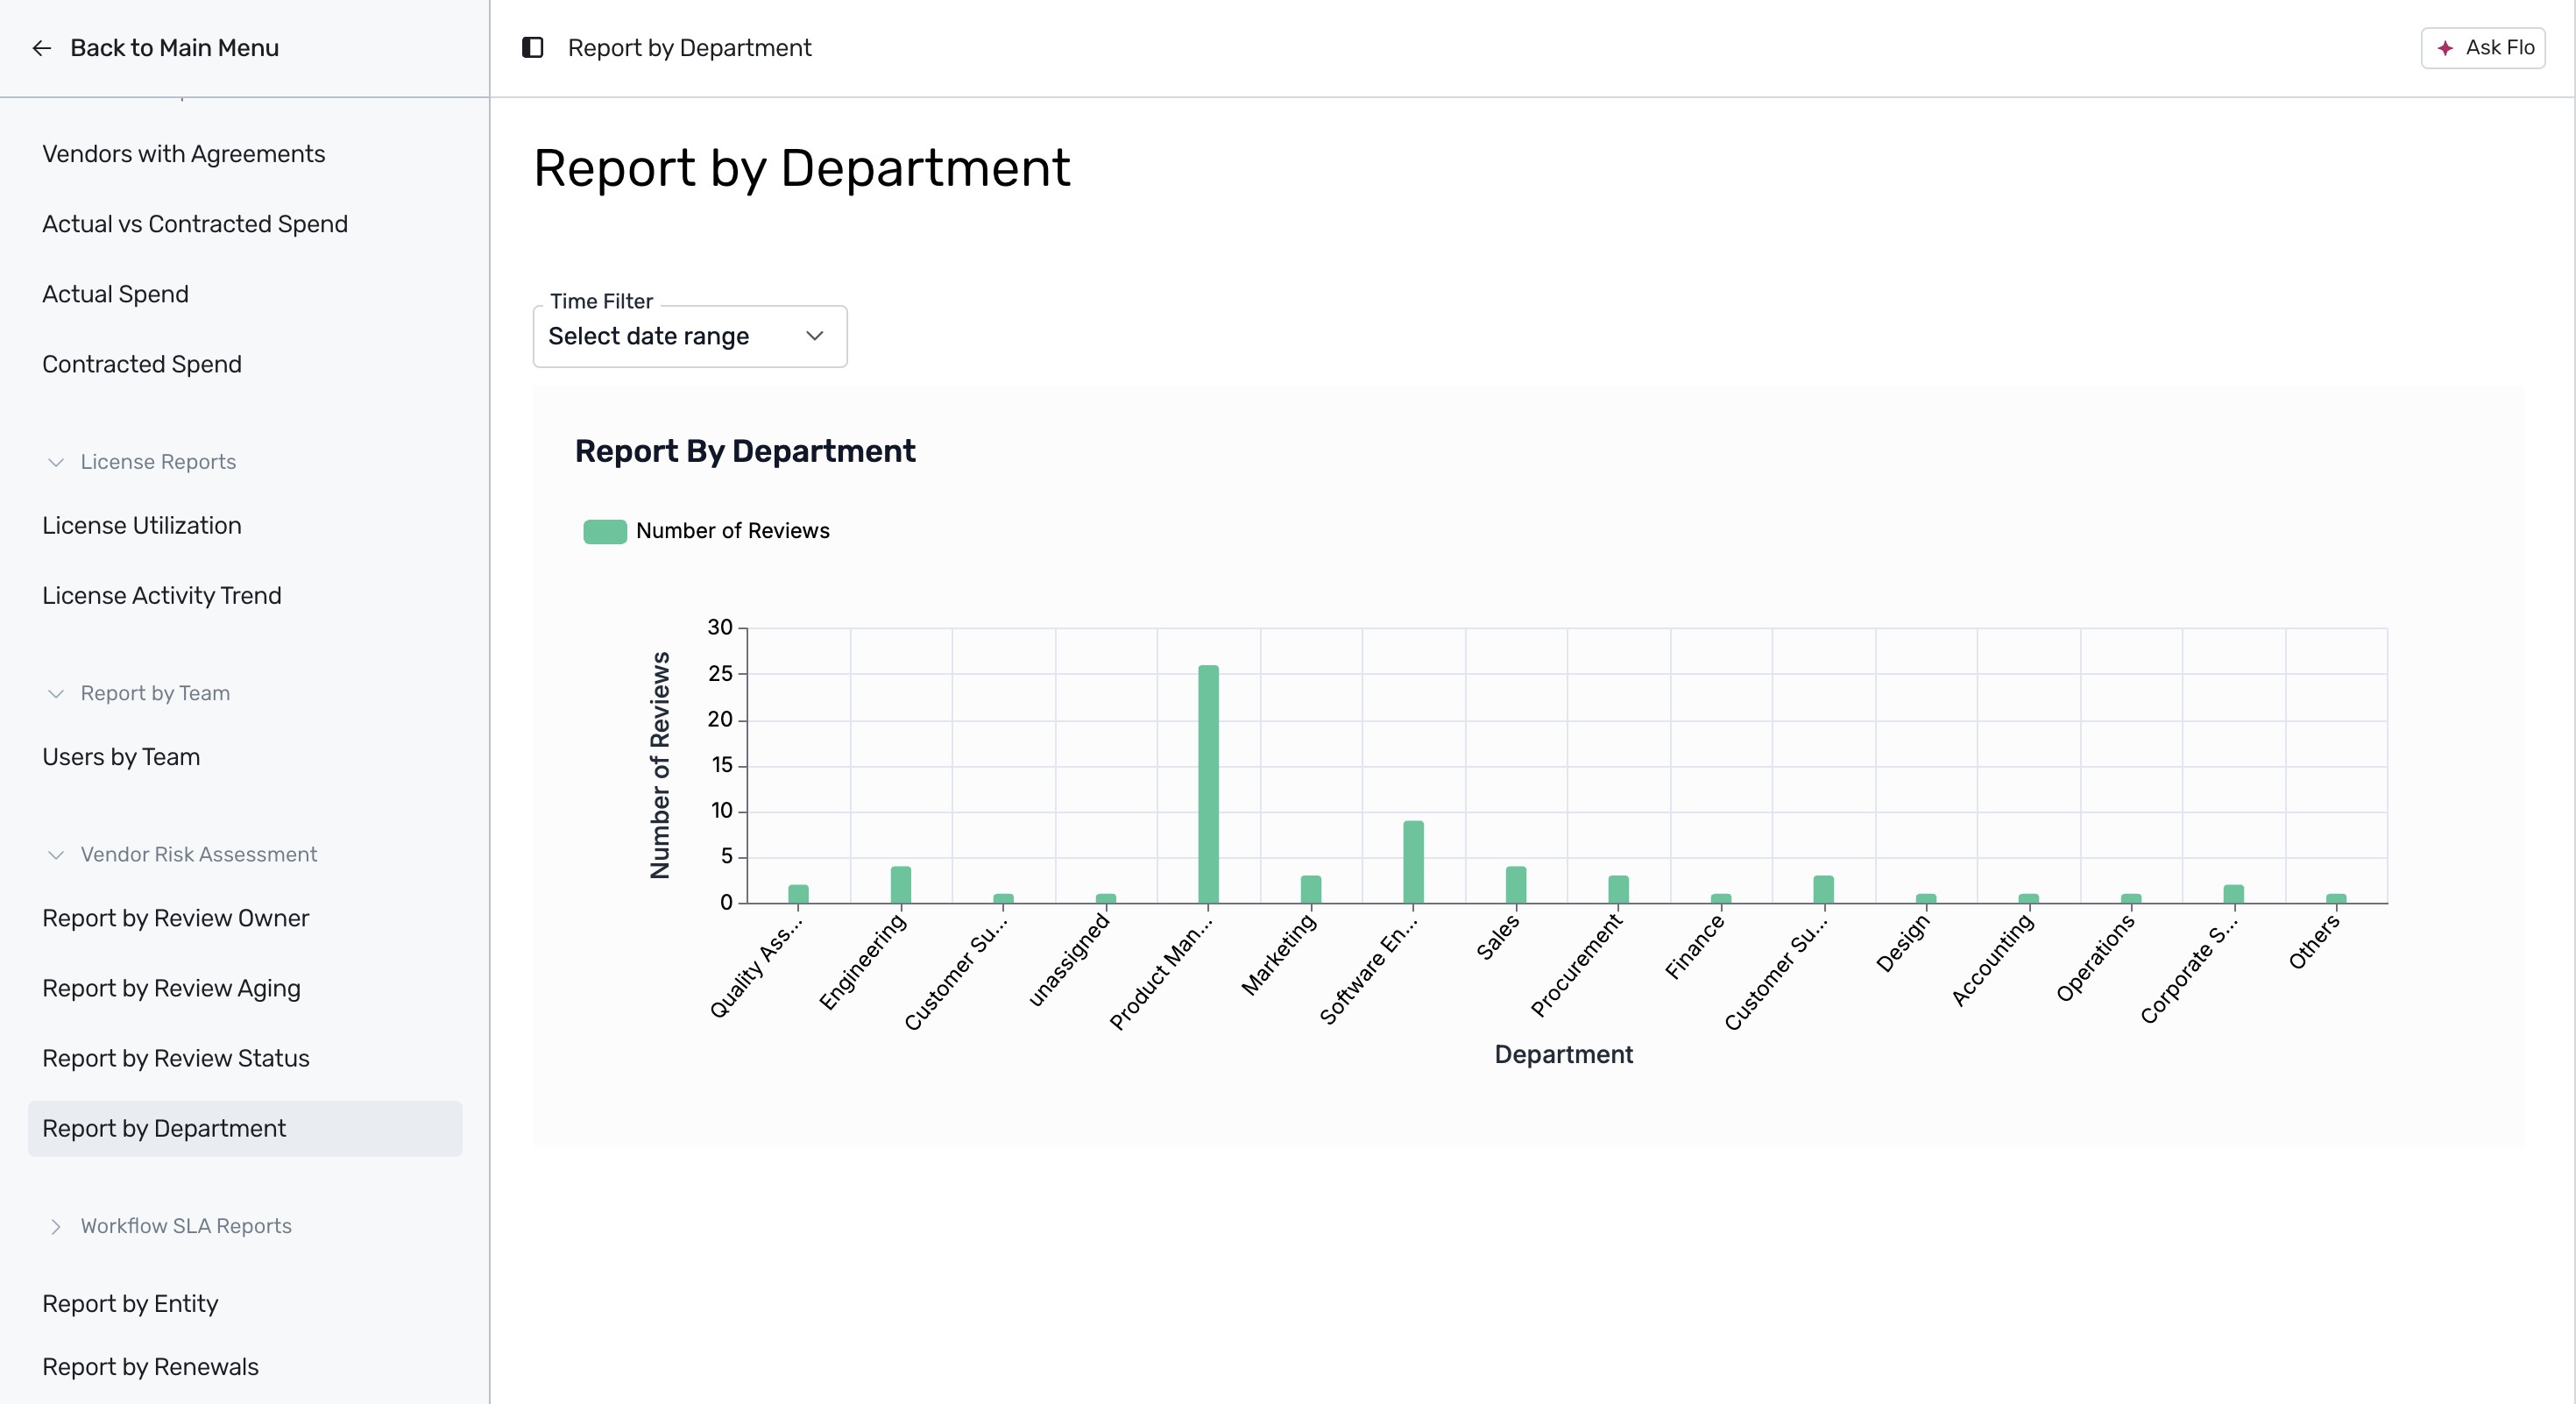
Click on Report by Department to view the volume of vendor risk reviews associated with each department.
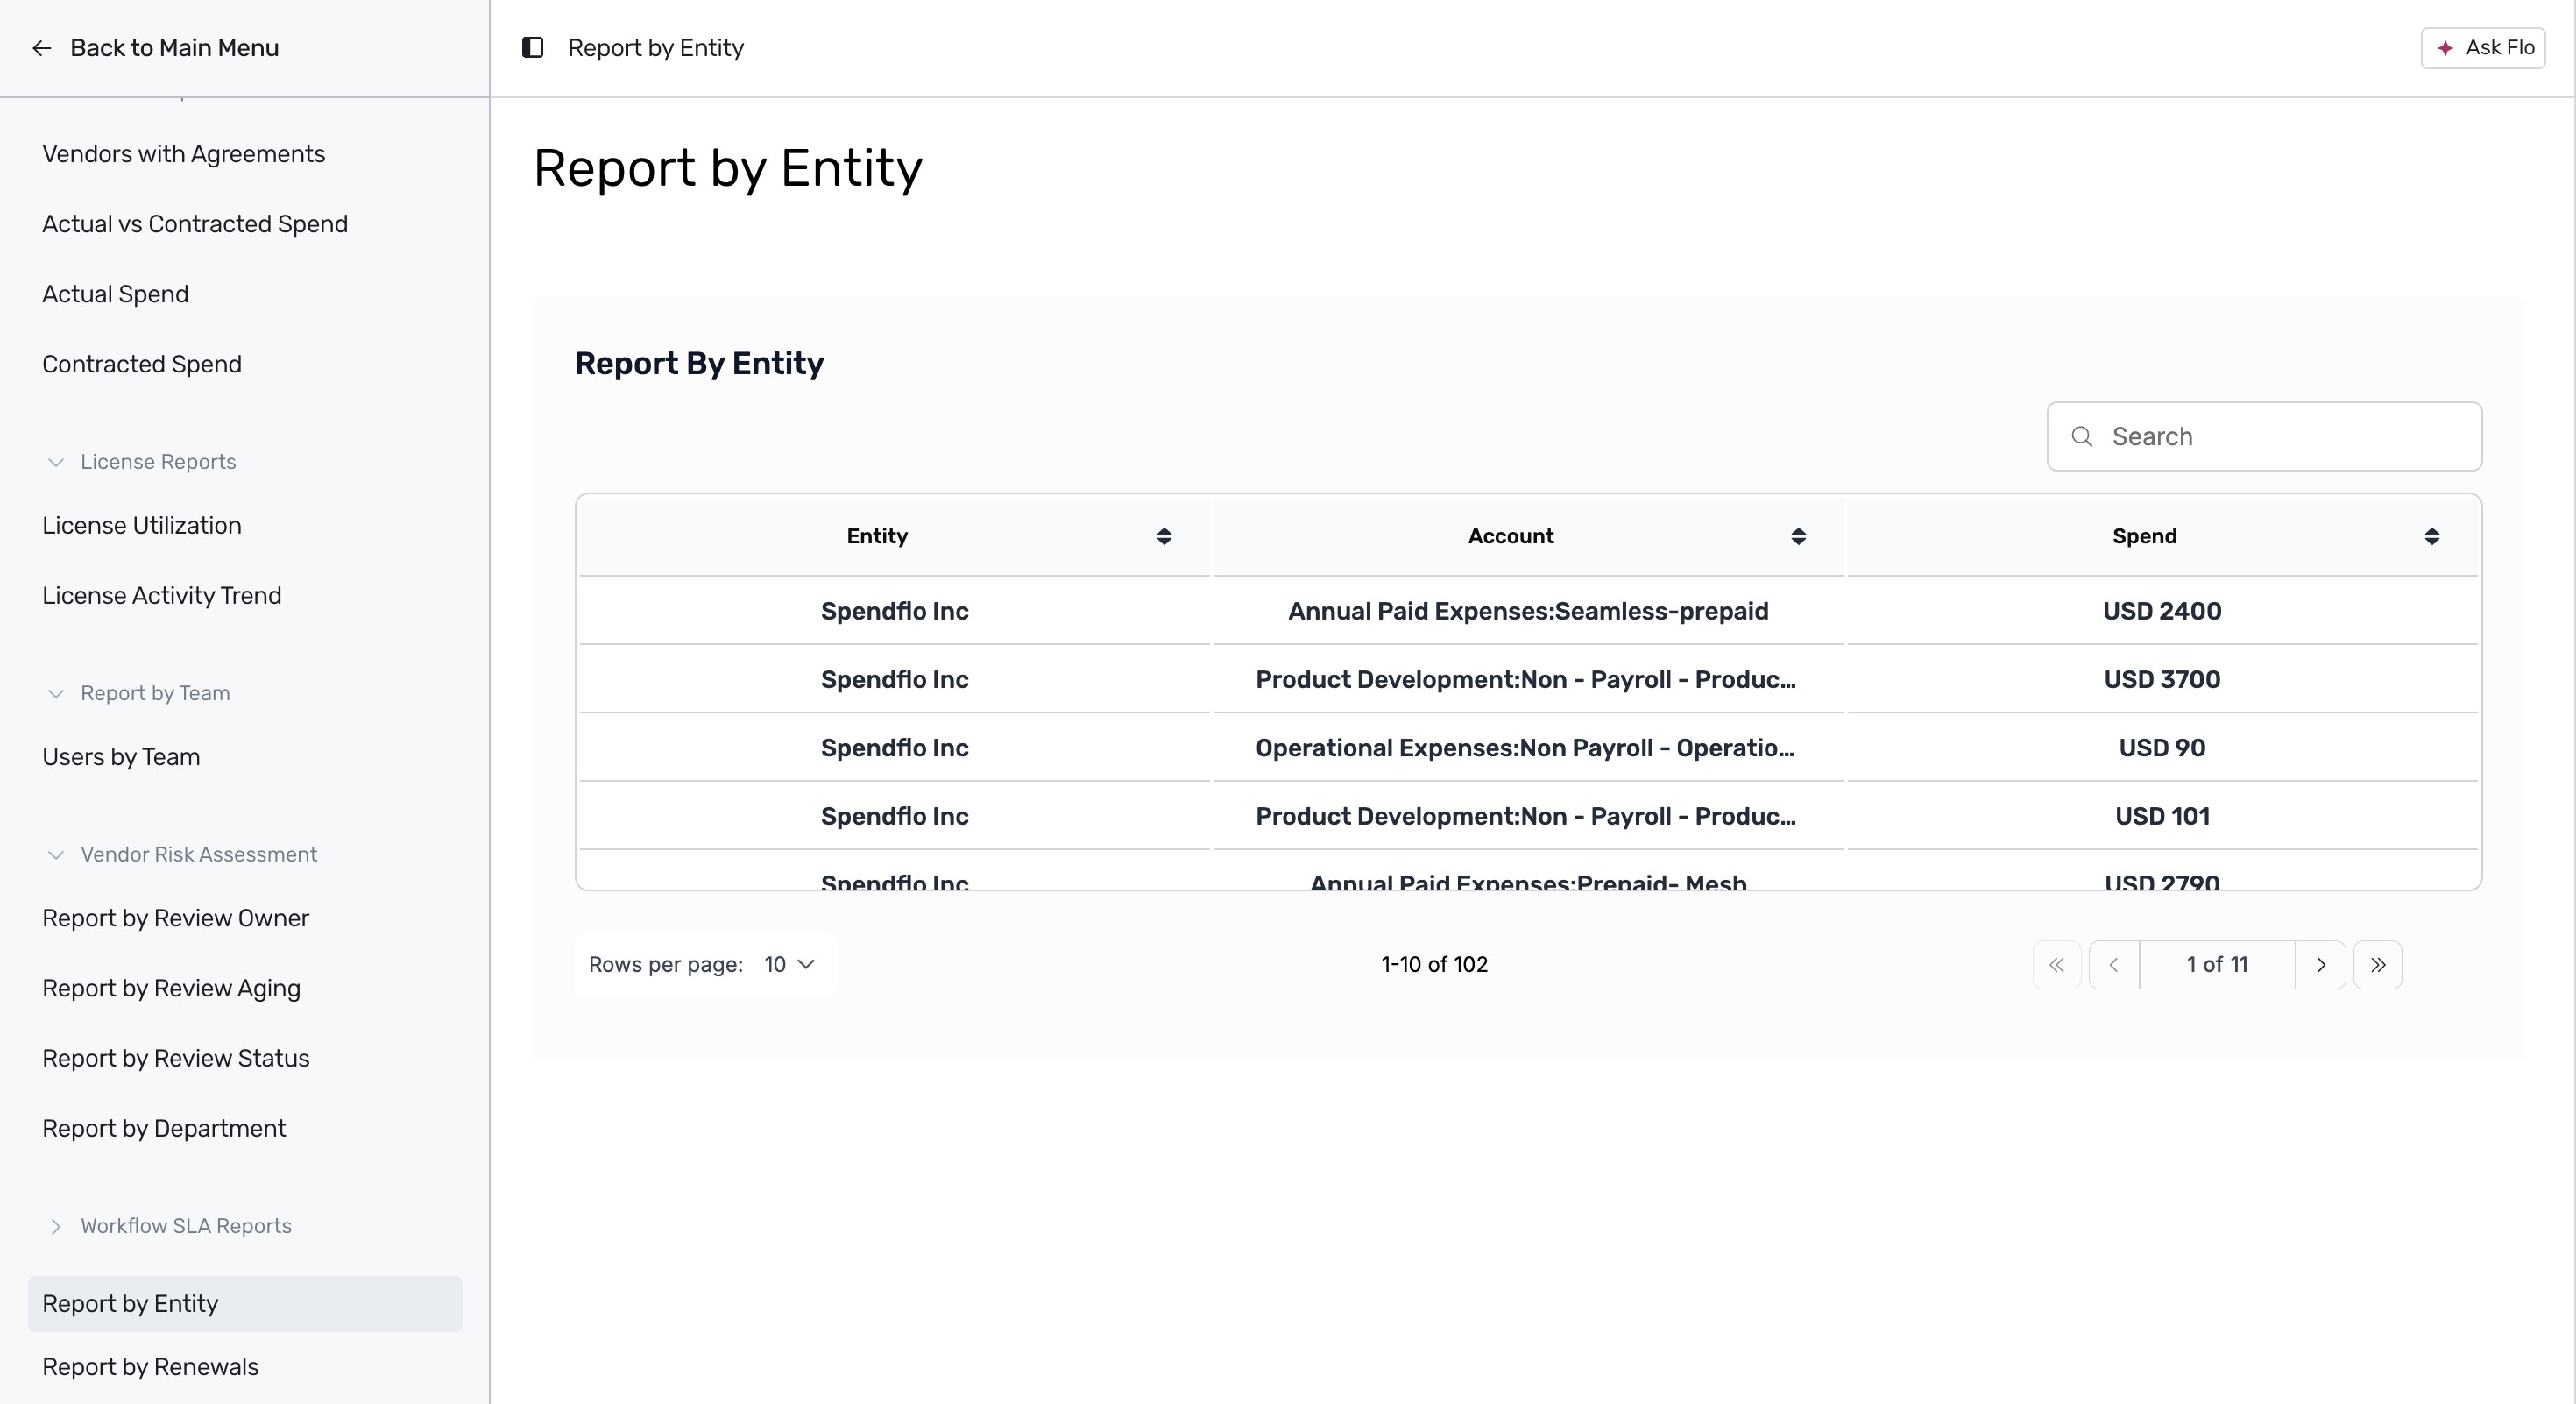
Click on Report by Entity in the left sidebar to view a tabular list of accounts and spend mapped to each legal entity.
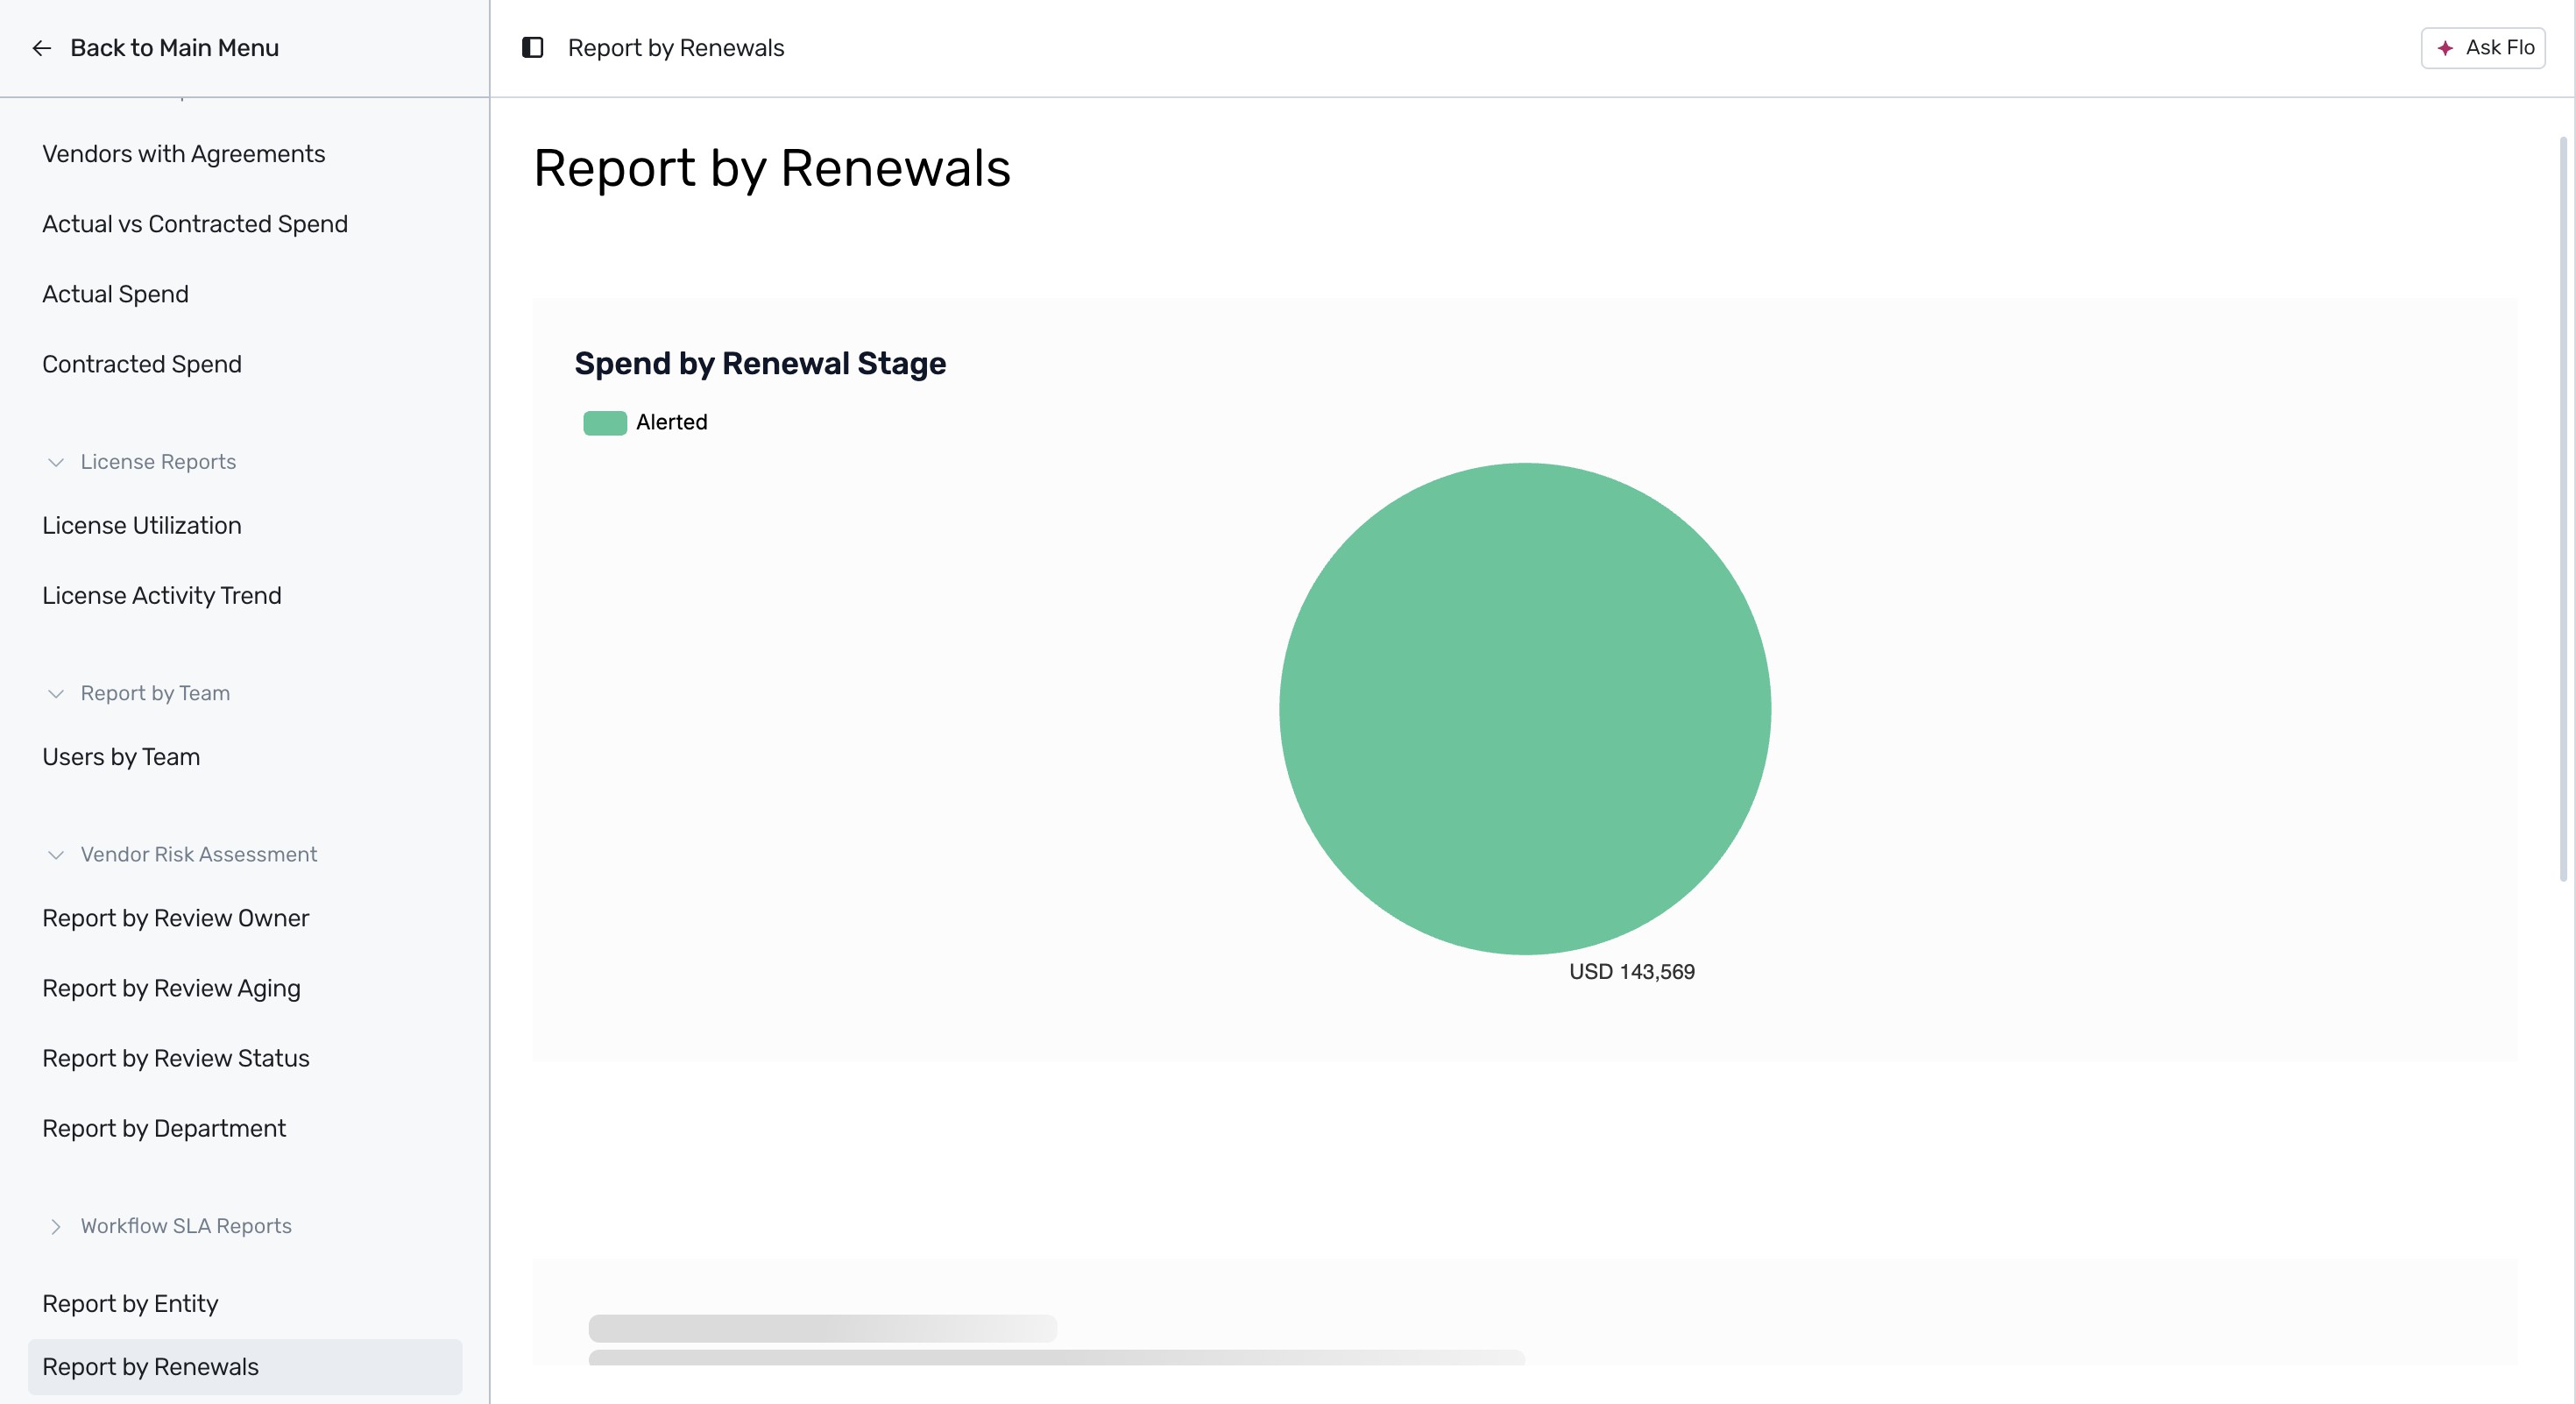
Finally, click on Report by Renewals to view a pie chart breakdown of your spend categorized by renewal stage. For more information on managing renewals.
These pre-built reports provide a robust foundation for analyzing your SaaS environment across various departments and vendor contracts.
Next Steps
Now that you are familiar with the pre-built reports available in Spendflo, you can use these insights to optimize your SaaS spend, track license utilization, and manage vendor risk assessments.
Was this article helpful?
That’s Great!
Thank you for your feedback
Sorry! We couldn't be helpful
Thank you for your feedback
Feedback sent
We appreciate your effort and will try to fix the article